Quickstart Guides: Arduino IDE 2
Since PyAvrOCD is integrated into the Arduino IDE 2, it is pretty easy to start debugging. Below, you will find four quickstart guides to start embedded debugging in the Arduino IDE 2 using the following hardware:
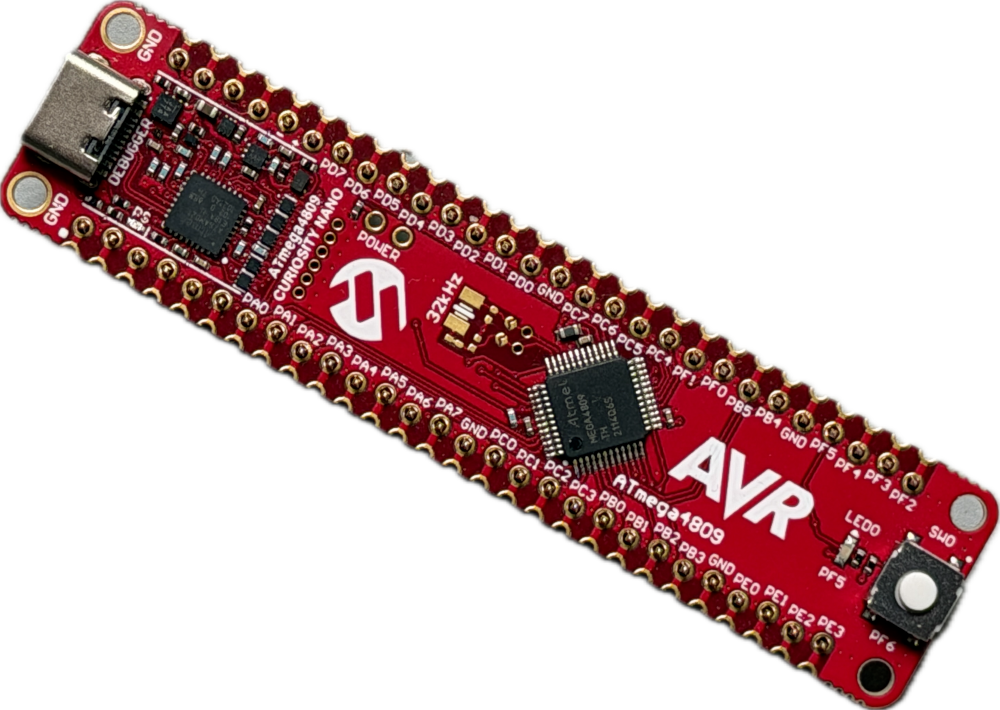
Quickstart: Curiosity Nano
The Curiosity Nano development boards provide an ideal and affordable entry into embedded programming and debugging because they have a debugger already on board. This makes it a plug-and-play experience.
Required hardware
You need a Curiosity Nano board and a USB cable to connect the board to your computer.
Step 1: Install a debug-enabled Arduino package
Add new boards manager URLs in the Preferences dialog:1
https://felias-fogg.github.io/MegaCoreX/package_MCUdude_MegaCoreX_index.json
https://felias-fogg.github.io/megaTinyCore/package_SpenceKonde_megaTinyCore_index.json
https://felias-fogg.github.io/DxCore/package_SpenceKonde_DxCore_index.json
How to enter a new boards manager URL
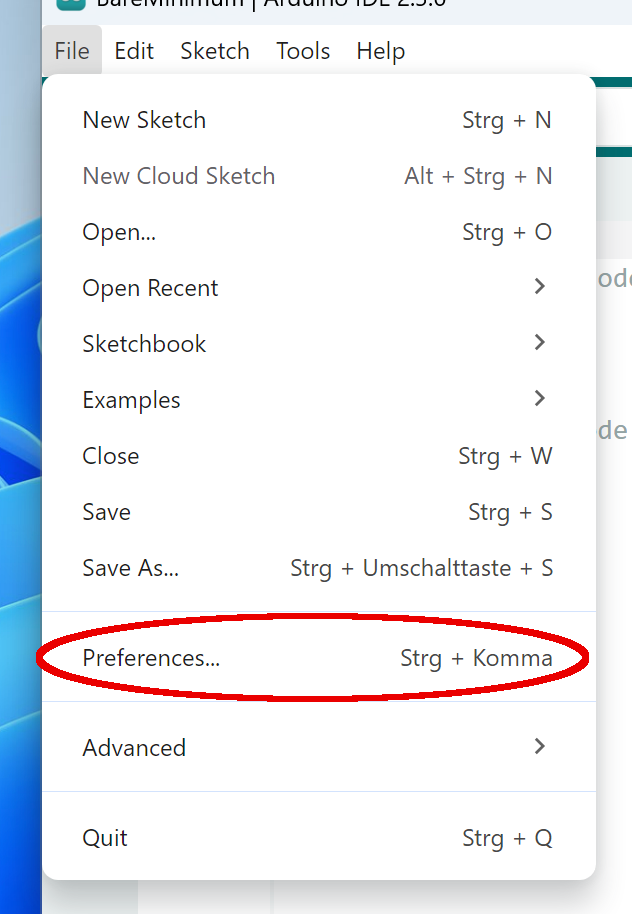
First you need to open the Preferences dialog, which you find either in the Arduino IDE or the File menu.
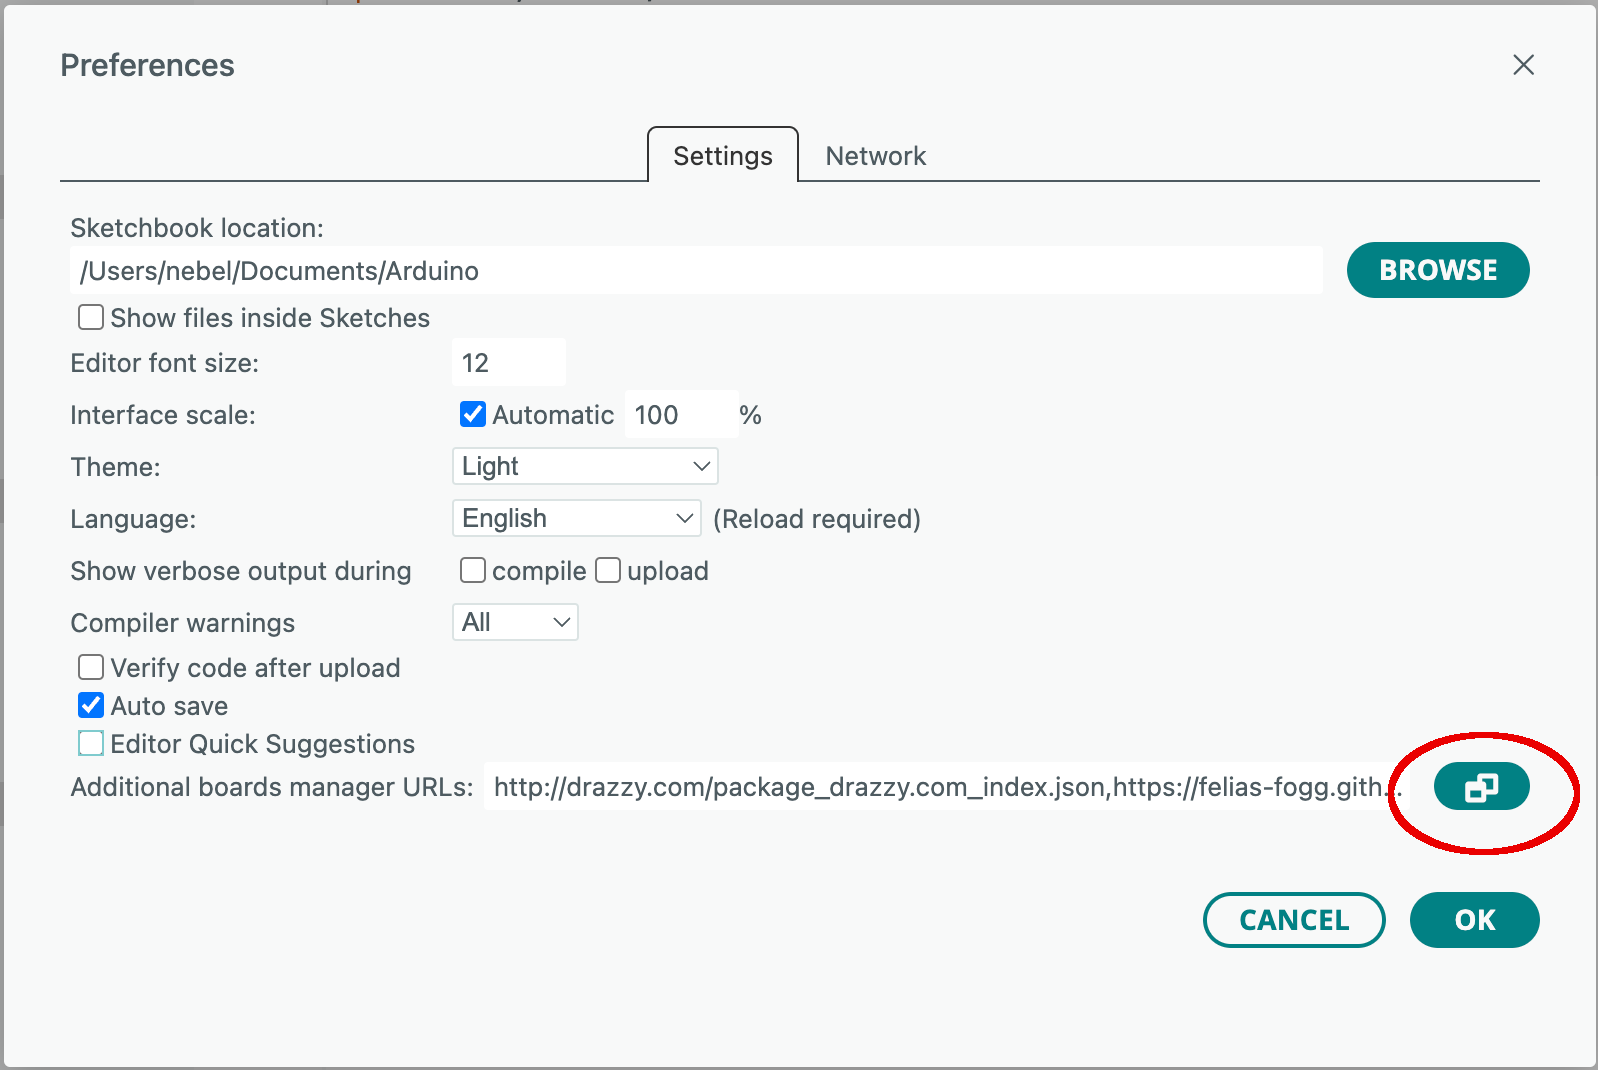
Next you have to open the field Additional boards manager URLs.
Now type in the package index URL.
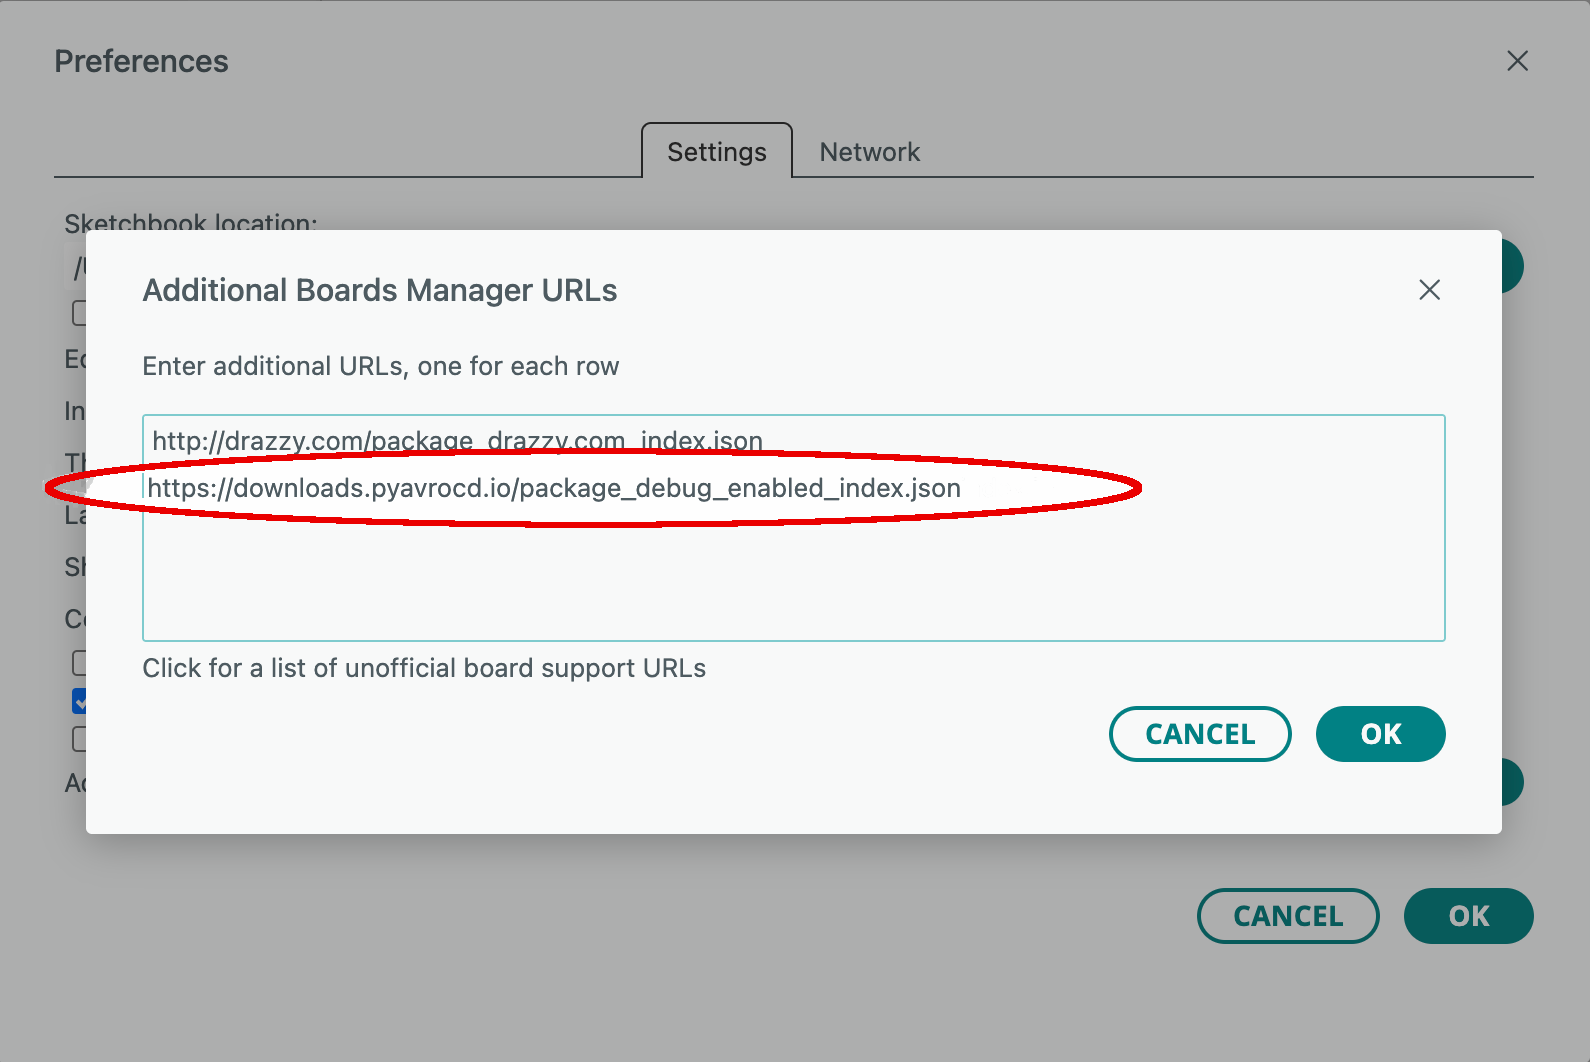
Finish the dialog by clicking on two OK buttons in succession.
Next, you have to install the appropriate Arduino package. Activate the Boards Manager, select the most recent versions of the package you want to install, and click on Install.
How to install a new Arduino package or update an existing one
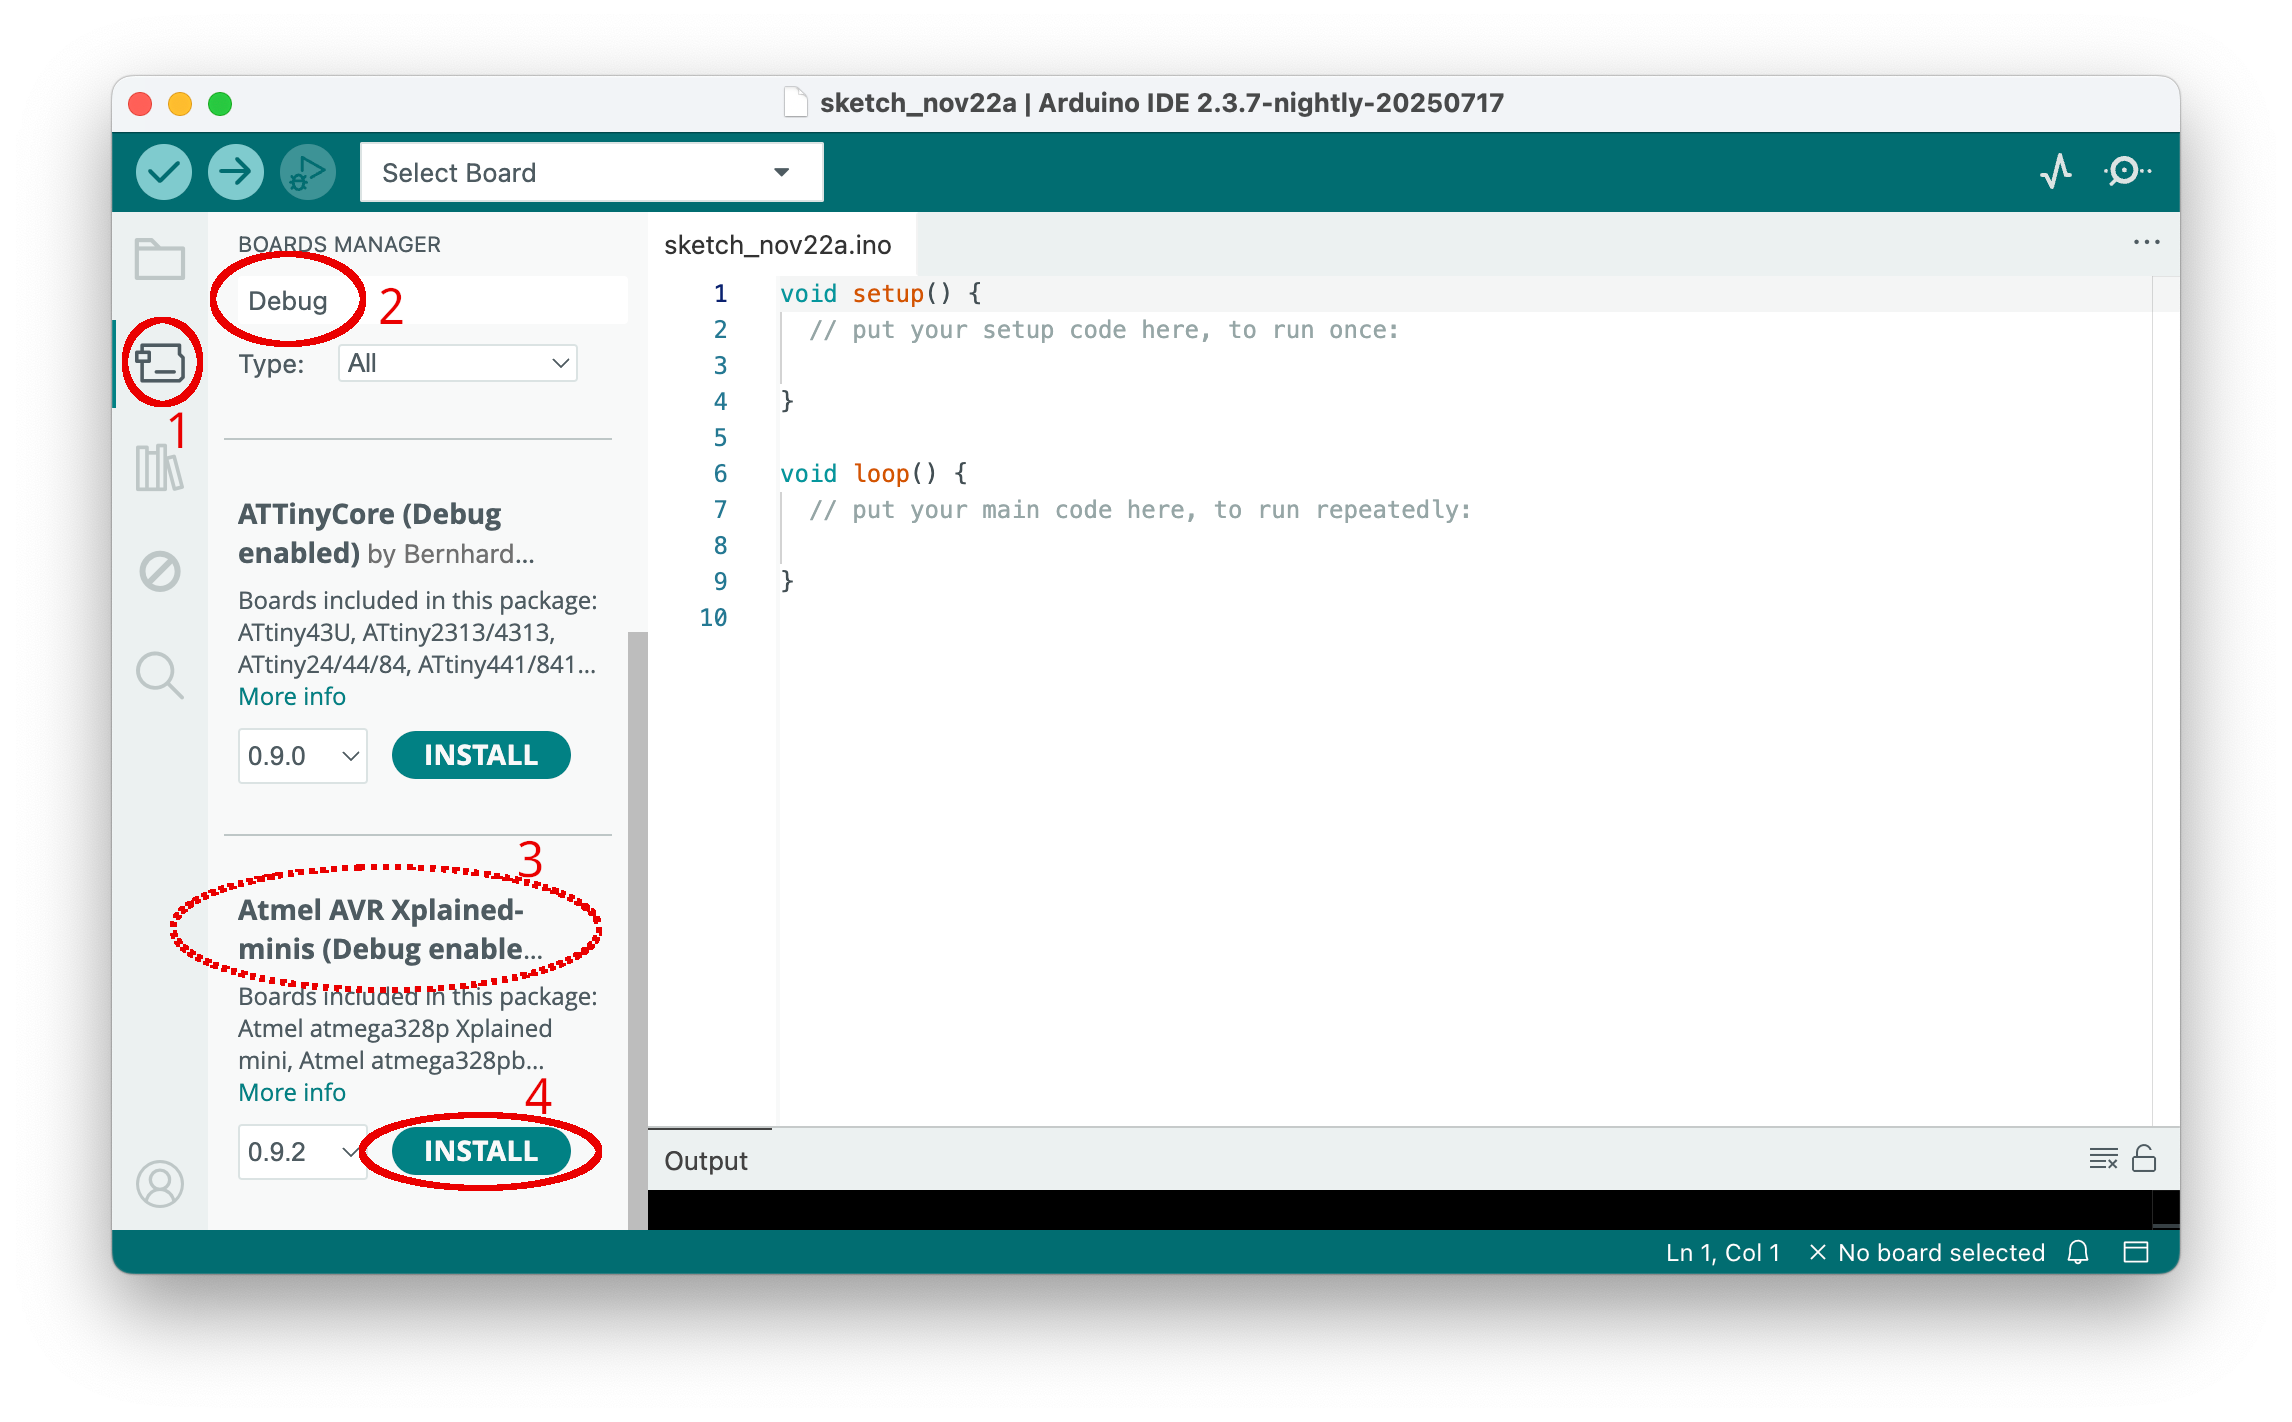
You need to activate the Boards Manager by clicking on the board symbol in the left side bar (1). After the boards manager pane has been opened, type part of the package's name into the search line (2). Then all packages with the search word in their description are displayed. Scroll down until you see the one you want to install (3). Install this package by clicking on Install (4). If the package is already installed, then an Update button will be shown that you need to click on.
Linux systems
After the installation, users of Linux systems will need to add udev rules. Download https://pyavrocd.io/99-edbg-debuggers.rules, edit if you want, and copy to /etc/udev/rules.d/.
Step 2: Load sketch and select board
Load a sketch, e.g., the Blink sketch, and select the right board: Tools -> Board -> <package> -> <board>. If you want to use serial I/O, you need to select the right Port in the Tools menu. The boards do not always use the standard serial interface. Check out the section on supported Microchip boards. Finally, you may want to set a few additional options in the Tools menu, such as the chip, the pinout, etc.
Step 3: Compile the sketch
Activate Optimize for Debugging in the Sketch menu. This only needs to be done once. Then click on the Verify button (checkmark) in the top bar. This will compile the sketch.
Step 4: Debug the sketch
It is time to start debugging by clicking the Debug button (bug in front of a triangle) in the top bar. This will open the DEBUG pane after a while. Now you can start and stop execution, inspect variables, set breakpoints, and the like (see section on debugging). Clicking on the red square in the top bar of the DEBUG pane will terminate the current debugging episode.
Step 5: Start over or terminate the debugging session
You can now edit the sketch and start again at step 3. Note that you always have to recompile and restart the debugger before any changes you made to the sketch are effective.
If you want to stop debugging, it may be a good idea to deactivate the Optimize for Debugging option.
Potential problems
If something goes wrong, it is a good idea to have a look at the output of the gdb-server console. Messages with the prefix [CRITICAL] often tell what went wrong. It may also be a good idea to consult the Troubleshooting and the Limitations section of the PyAvrOCD manual.
Quickstart: ATmega328P Xplained Mini
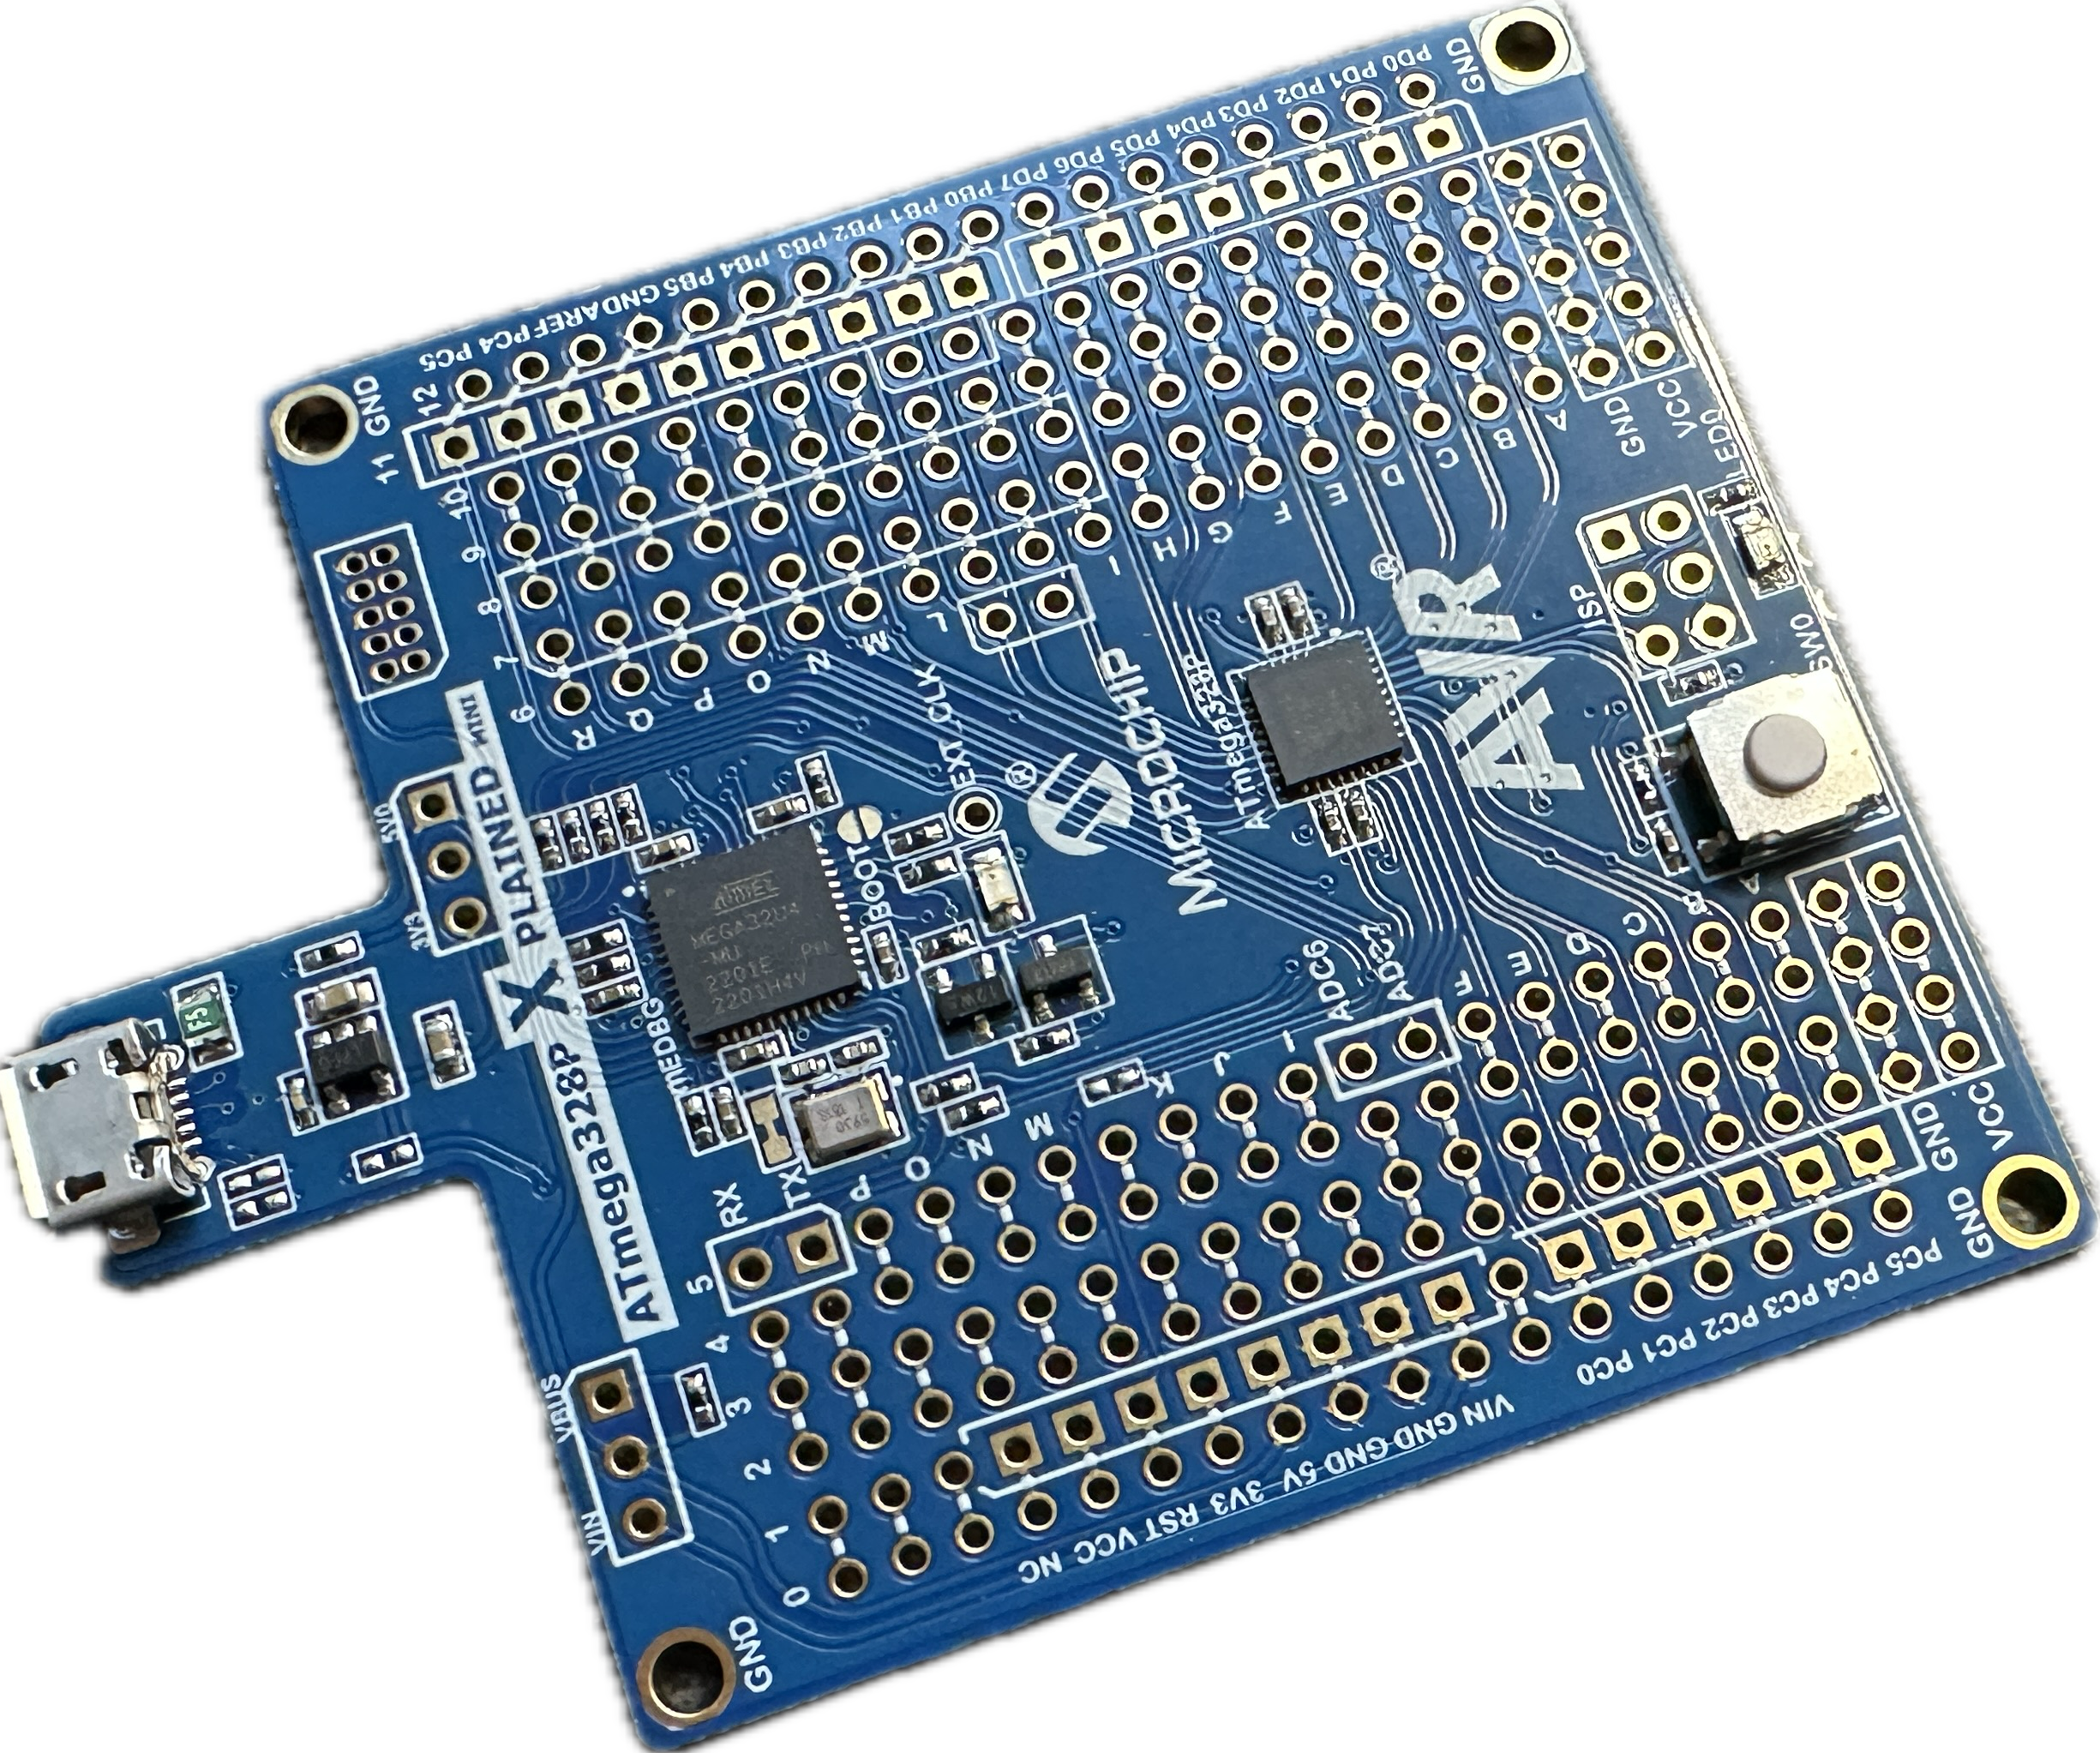
The Atmega328P Xplained Mini development board, which has an Arduino Uno footprint, is ideal for making a first experience with embedded debugging because it already contains an onboard debugger. It is simply plug-and-play.
Required hardware
The only thing you need is the XPlained Mini board and a USB cable to connect it to your computer.
Step 1: Install the debug-enabled XMiniCore
Add a new boards manager URL in the Preferences dialog:
https://felias-fogg.github.io/XMiniCore/package_felias-fogg_XMiniCore_index.json
How to enter a new boards manager URL
First you need to open the Preferences dialog, which you find either in the Arduino IDE or the File menu.
Next you have to open the field Additional boards manager URLs.
Now type in the package index URL.
Finish the dialog by clicking on two OK buttons in succession.
Next you have to install the new package. Activate the Boards Manager, select XMiniCore, and click on Install.
How to install a new Arduino package or update an existing one
You need to activate the Boards Manager by clicking on the board symbol in the left side bar (1). After the boards manager pane has been opened, type part of the package's name into the search line (2). Then all packages with the search word in their description are displayed. Scroll down until you see the one you want to install (3). Install this package by clicking on Install (4). If the package is already installed, then an Update button will be shown that you need to click on.
Linux systems
After the installation, users of Linux systems will need to add udev rules. Download https://pyavrocd.io/99-edbg-debuggers.rules, edit if you want, and copy to /etc/udev/rules.d/.
Step 2: Load sketch and select board
Load a sketch, e.g., the Blink sketch, and select the right board: Tools -> Board -> XMiniCore -> Atmel atmega328p Xplained mini. If you want to use serial I/O, you may also want to select the right Port in the Tools menu.
Step 3: Compile and upload the sketch
Activate Optimize for Debugging in the Sketch menu. This only needs to be done once. Then click on the Upload button (arrow to the right) in the top bar. This will compile and upload the sketch.
Step 4: Debug the sketch
It is time to start debugging by clicking the Debug button (bug in front of a triangle) in the top row. This will open the DEBUG pane after a while. Now you can start and stop execution, inspect variables, set breakpoints, and the like (see section on debugging). Clicking on the red square in the top bar of the DEBUG pane will terminate the current debugging episode.
Step 5: Start over or terminate the debugging session
You can now edit the sketch and start again at step 3. Note that you always have to recompile and restart the debugger before any changes you made to the sketch are effective.
If you want to stop debugging, it may be a good idea to deactivate the Optimize for Debugging option again.
Potential problems
If something goes wrong, it is a good idea to have a look at the output of the gdb-server console. Messages with the prefix [CRITICAL] often tell what went wrong. It may also be a good idea to consult the Troubleshooting and the Limitations section of the PyAvrOCD manual.
Warning: Use IOREF to source attached circuits
If you have any attached circuitry, be it on a breadboard or a shield, use the IOREF pin to power it. If this is not possible, check out the README file of XminiCore for a solution.
Quickstart: dw-link & Arduino UNO
This quickstart guide shows how to try out embedded debugging as offered by the Arduino IDE 2 without requiring you to invest in a debug probe. It will turn an Arduino Uno into a debug probe.
Required hardware
- Two Arduino UNO R3 (or similar),
- one USB cable (for the connection to the host),
- 6 jumper wires (male-male),
- a 10 µF electrolyte capacitor (optionally), and
- an LED with a 200 Ω resistor soldered to one leg (optionally).
Step 1: Turning an UNO into a debug probe
The simplest way to install the firmware is to download an uploader from the Release Assets of the dw-link GitHub repo. The uploader should fit your architecture, e.g., dw-uploader-windows-intel64 for Windows. Under Linux and macOS, open a terminal window, go to the download folder, and set the executable permission using chmod +x. Afterward, execute the program. Under Windows, it is enough to start the program after downloading by double-clicking on it.
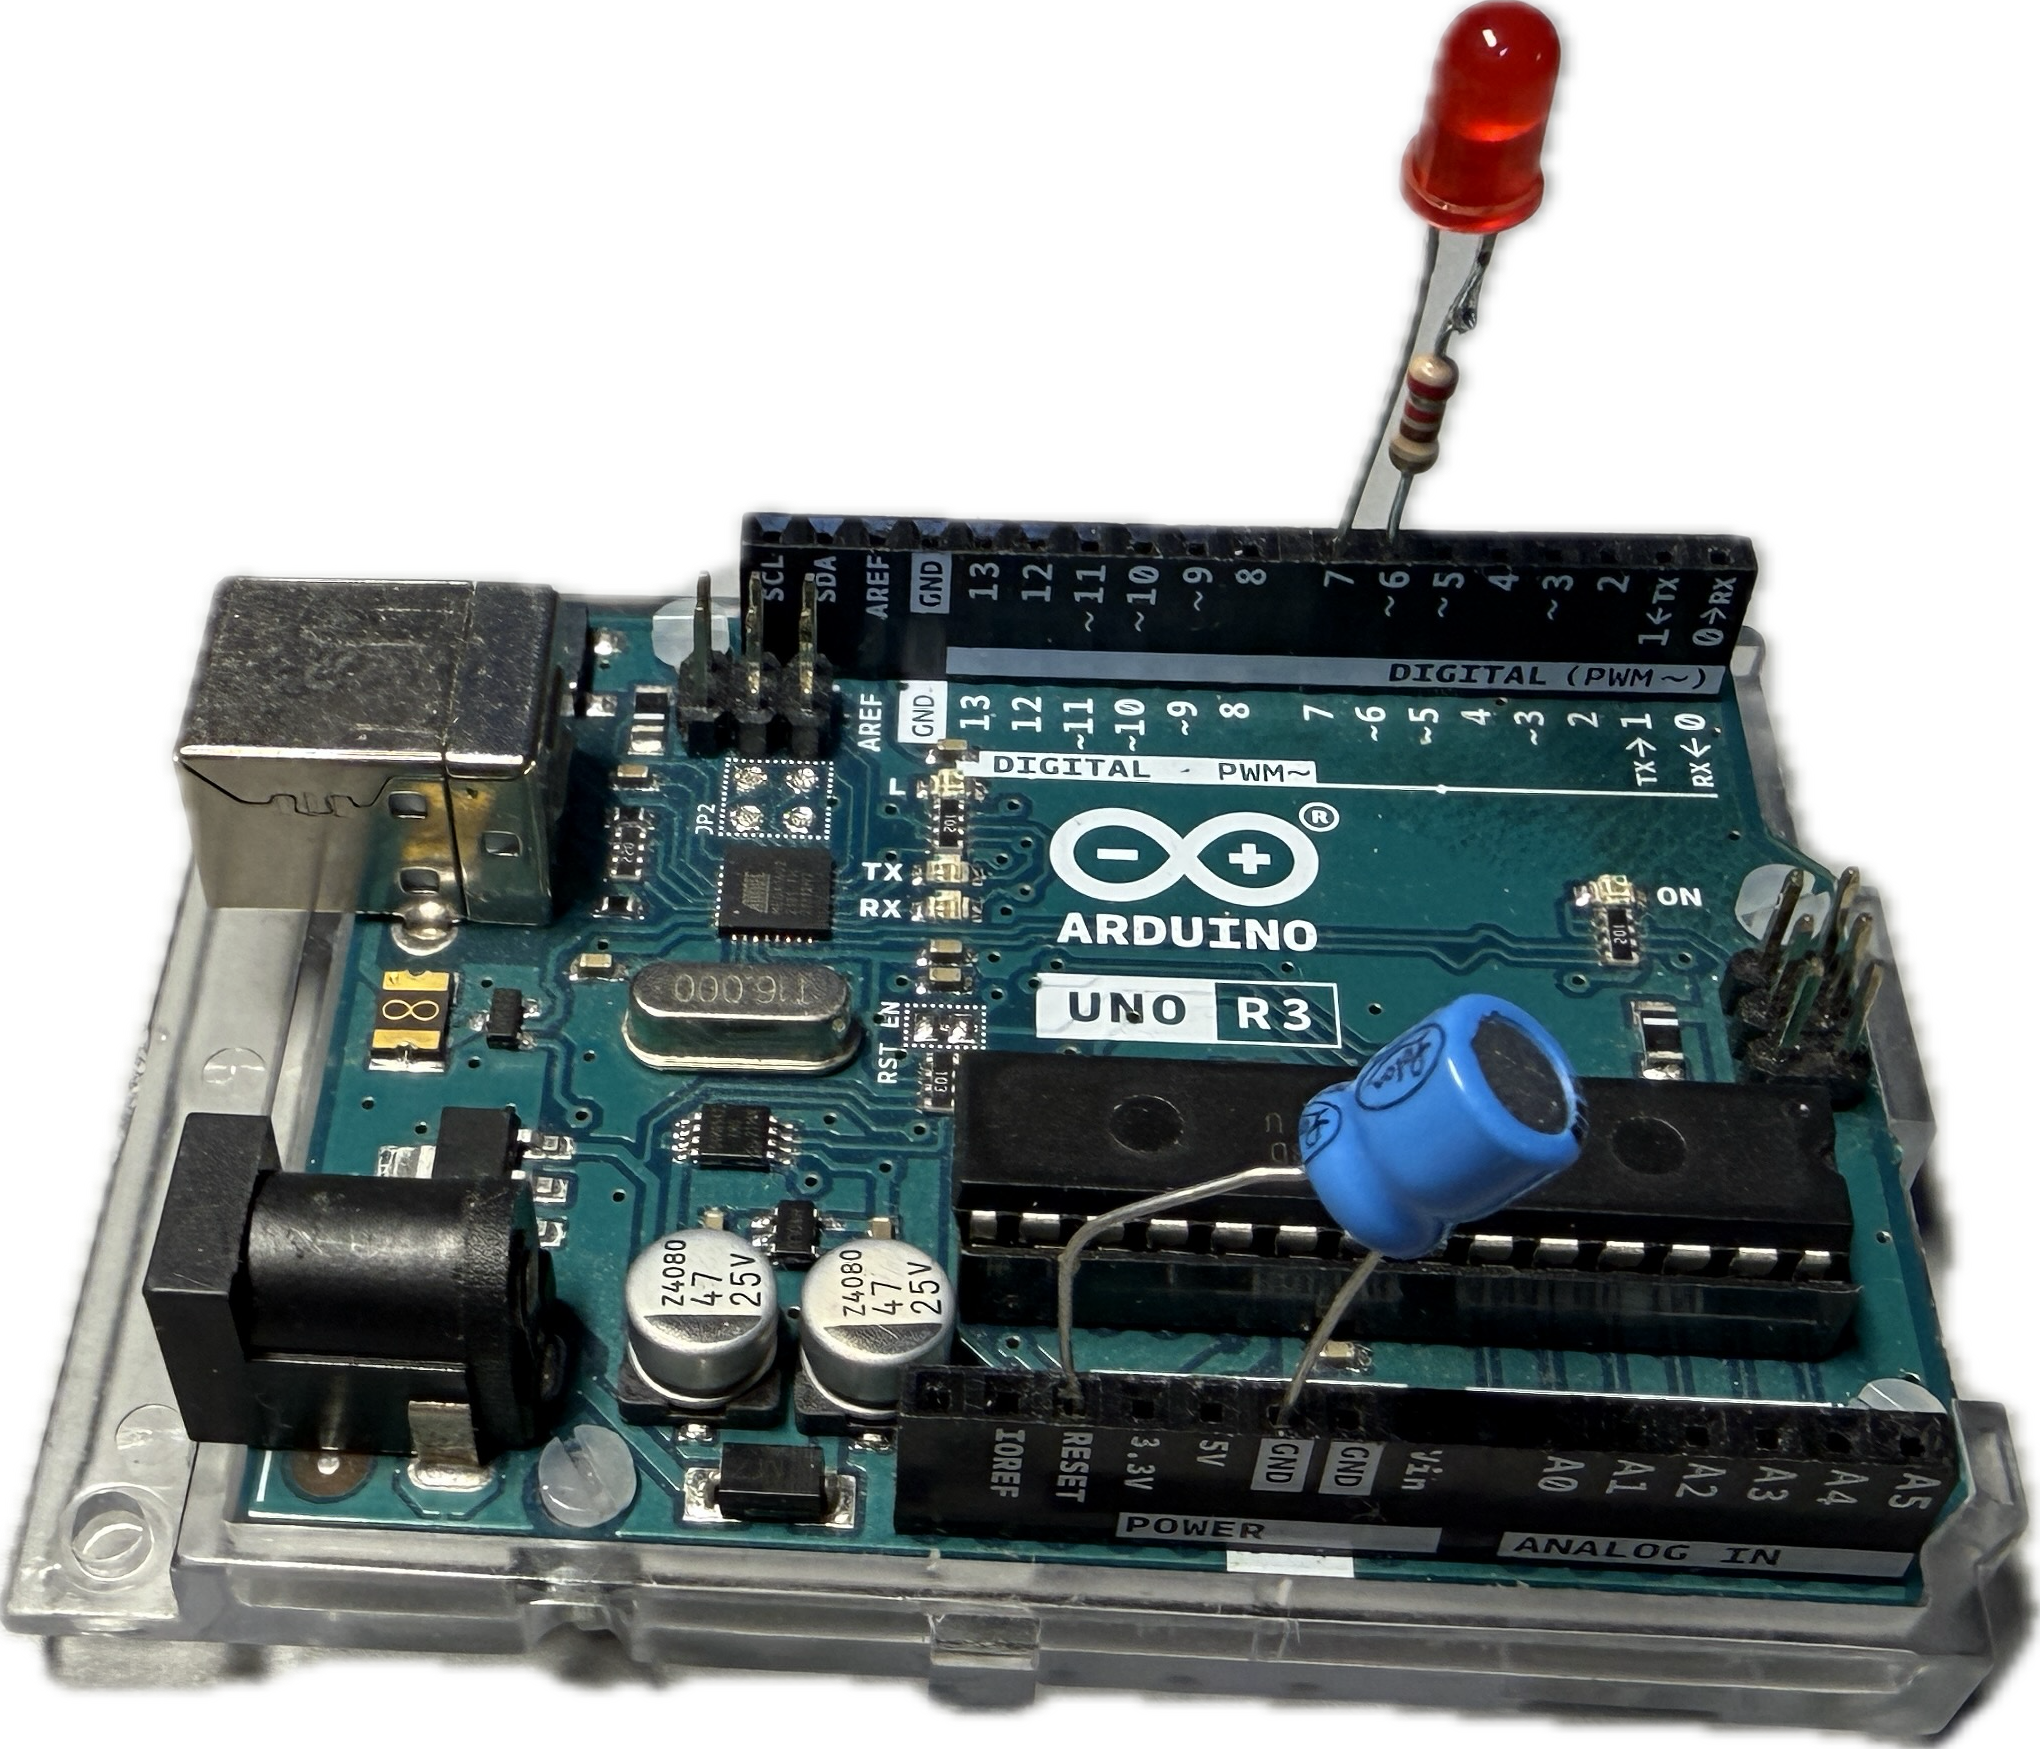
From now on, you can use this board as a debug probe. In order to make it easier to use, plug the (optional) electrolyte capacitor into the RESET and GND header (the negative pin goes into GND). This will make sure that the board does not go into RESET when the host contacts the debug probe. In addition, put the LED with the soldered-on resistor into the header 6 and 7, 6 being used as GND. The LED tells you the internal state of the debug probe:
- debugWIRE mode disabled (LED is off),
- waiting for power-cycling the target (LED flashes every second for 0.1 sec)
- debugWIRE mode enabled (LED is on),
- ISP programming (LED is blinking slowly, 0.5 sec on, 0.5 sec off),
- error state, i.e., not possible to connect to target or internal error (LED blinks furiously every 0.1 sec).
The completed board setup may then look as follows.
Step 2: Install the debug-enabled MiniCore
Since the stock Arduino AVR Boards package does not support debugging, we need to shop elsewhere. For this reason, you need to add a new boards manager URL in the Preferences dialog so that MiniCore can be installed:
https://mcudude.github.io/MiniCore/package_MCUdude_MiniCore_index.json
How to enter a new boards manager URL
First you need to open the Preferences dialog, which you find either in the Arduino IDE or the File menu.
Next you have to open the field Additional boards manager URLs.
Now type in the package index URL.
Finish the dialog by clicking on two OK buttons in succession.
Next you have to install the MiniCore. Activate the Boards Manager, select MiniCore, and click on Install.
How to install a new Arduino package or update an existing one
You need to activate the Boards Manager by clicking on the board symbol in the left side bar (1). After the boards manager pane has been opened, type part of the package's name into the search line (2). Then all packages with the search word in their description are displayed. Scroll down until you see the one you want to install (3). Install this package by clicking on Install (4). If the package is already installed, then an Update button will be shown that you need to click on.
Step 3: Prepare the target board for debugging
On an original UNO board, you need to cut a solder bridge labeled RESET EN in order to disconnect the auto-RESET enabling capacitor.
Picture showing the cut
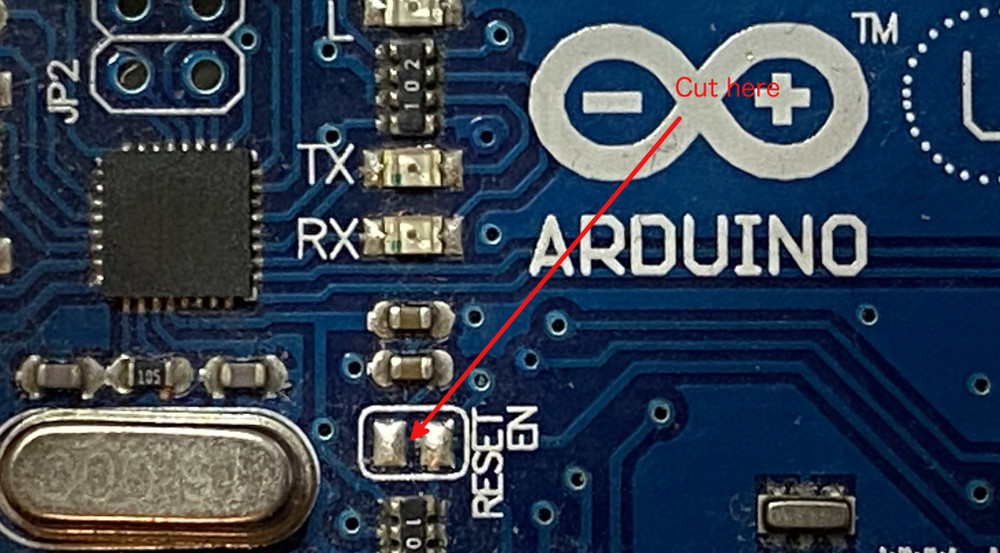
On other boards, similar modifications are most likely necessary.
Warning
Not disconnecting the capacitor (or other loads) from the RESET line of the MCU may lead to the situation that debugWIRE mode is activated on the MCU, but it is impossible to communicate with the MCU. In particular, one cannot leave debugWIRE mode anymore.
Step 4: Connect the target board with the debug probe
You have to connect all SPI programming pins except for the RESET line. This goes into the header slot 8 on the debug probe. A Fritzing sketch looks as follows.
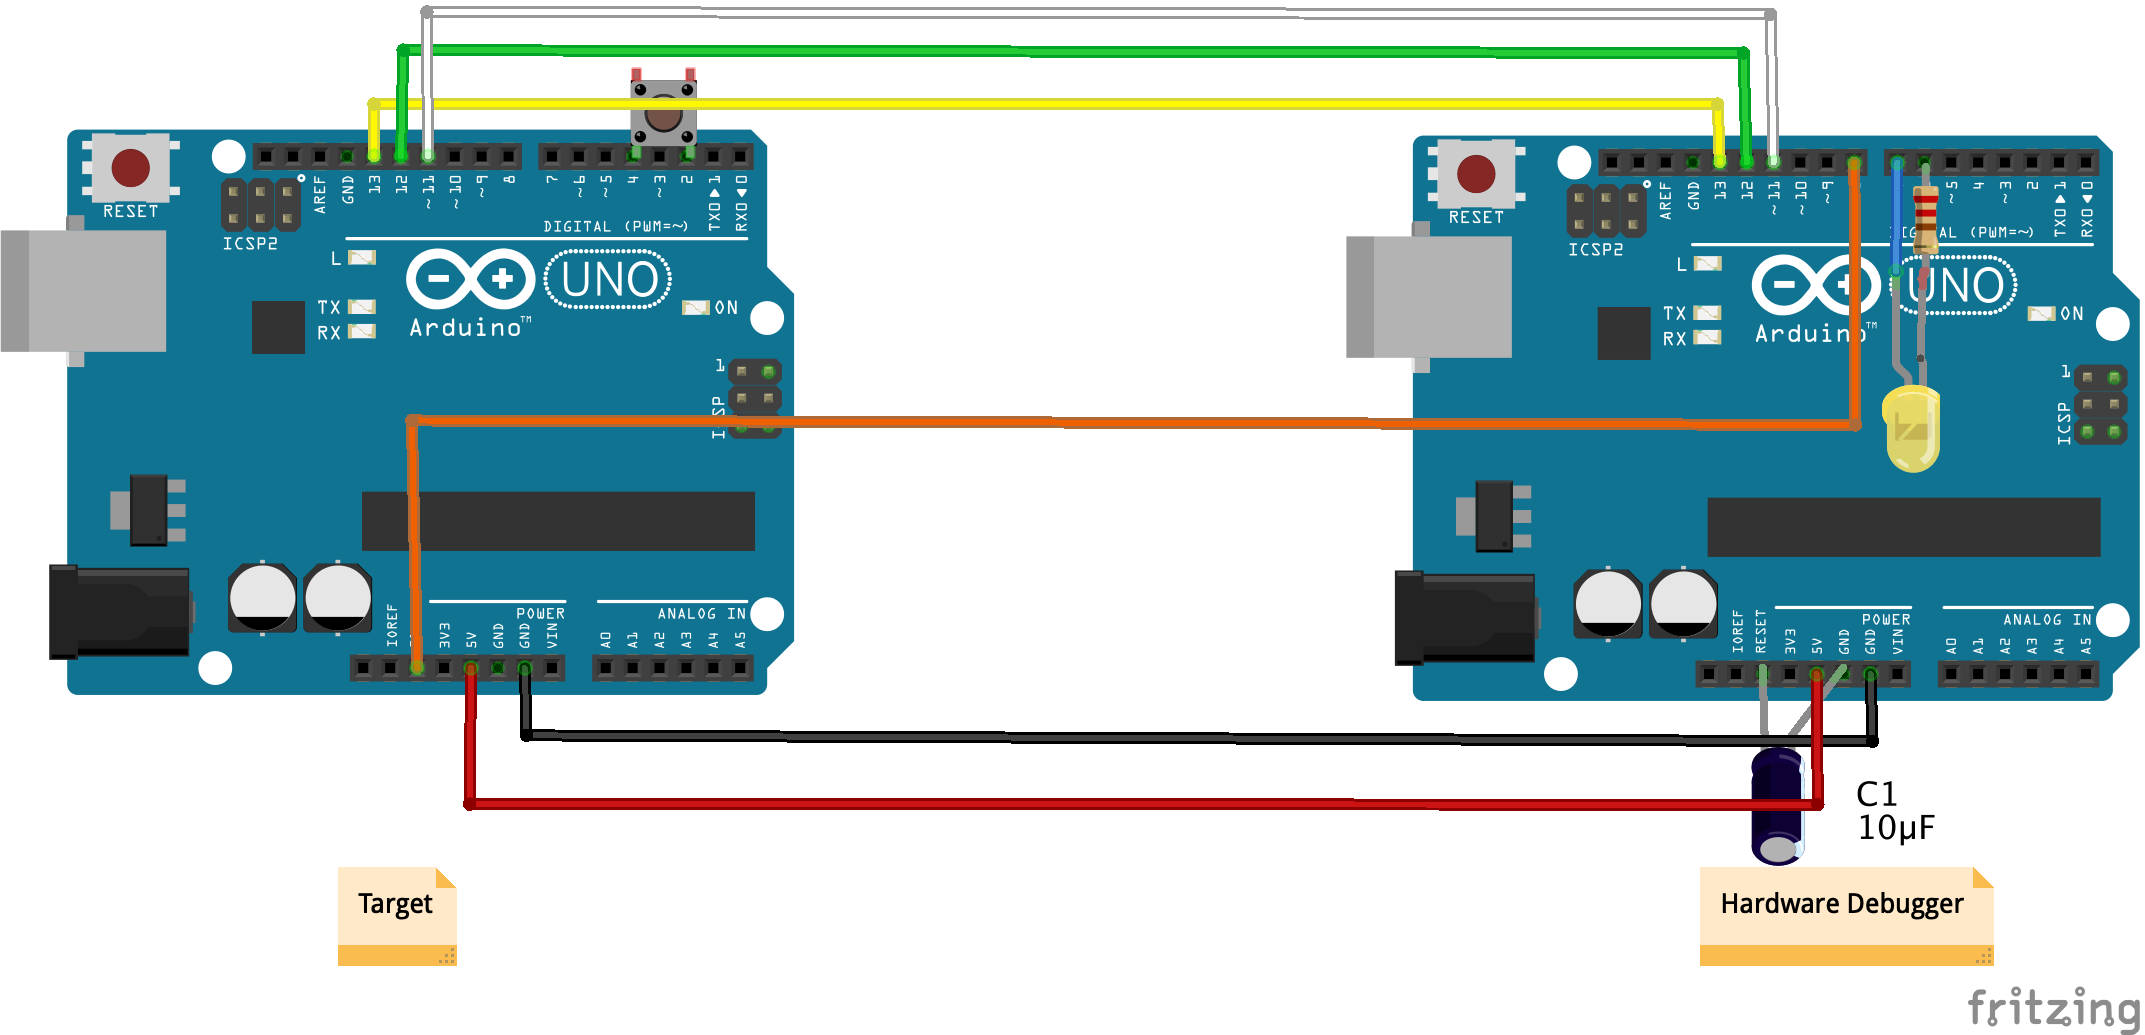
The USB connector must be plugged into the hardware debugger.
Step 5: Load sketch and select board
Load a sketch, e.g., the Blink sketch, and select the right board: Tools -> Board -> MiniCore -> ATmega328.
Step 6: Compile the sketch
Activate Optimize for Debugging in the Sketch menu. This only needs to be done once. Then click on the Verify button (leftmost button) in the top bar. This will compile the sketch.
Step 7: Start debugging
Now it is time to start debugging by clicking the Debug button (bug in front of a triangle) in the top bar. If the target MCU is not already in debugWIRE mode, the debugger will request 'power cycling'.
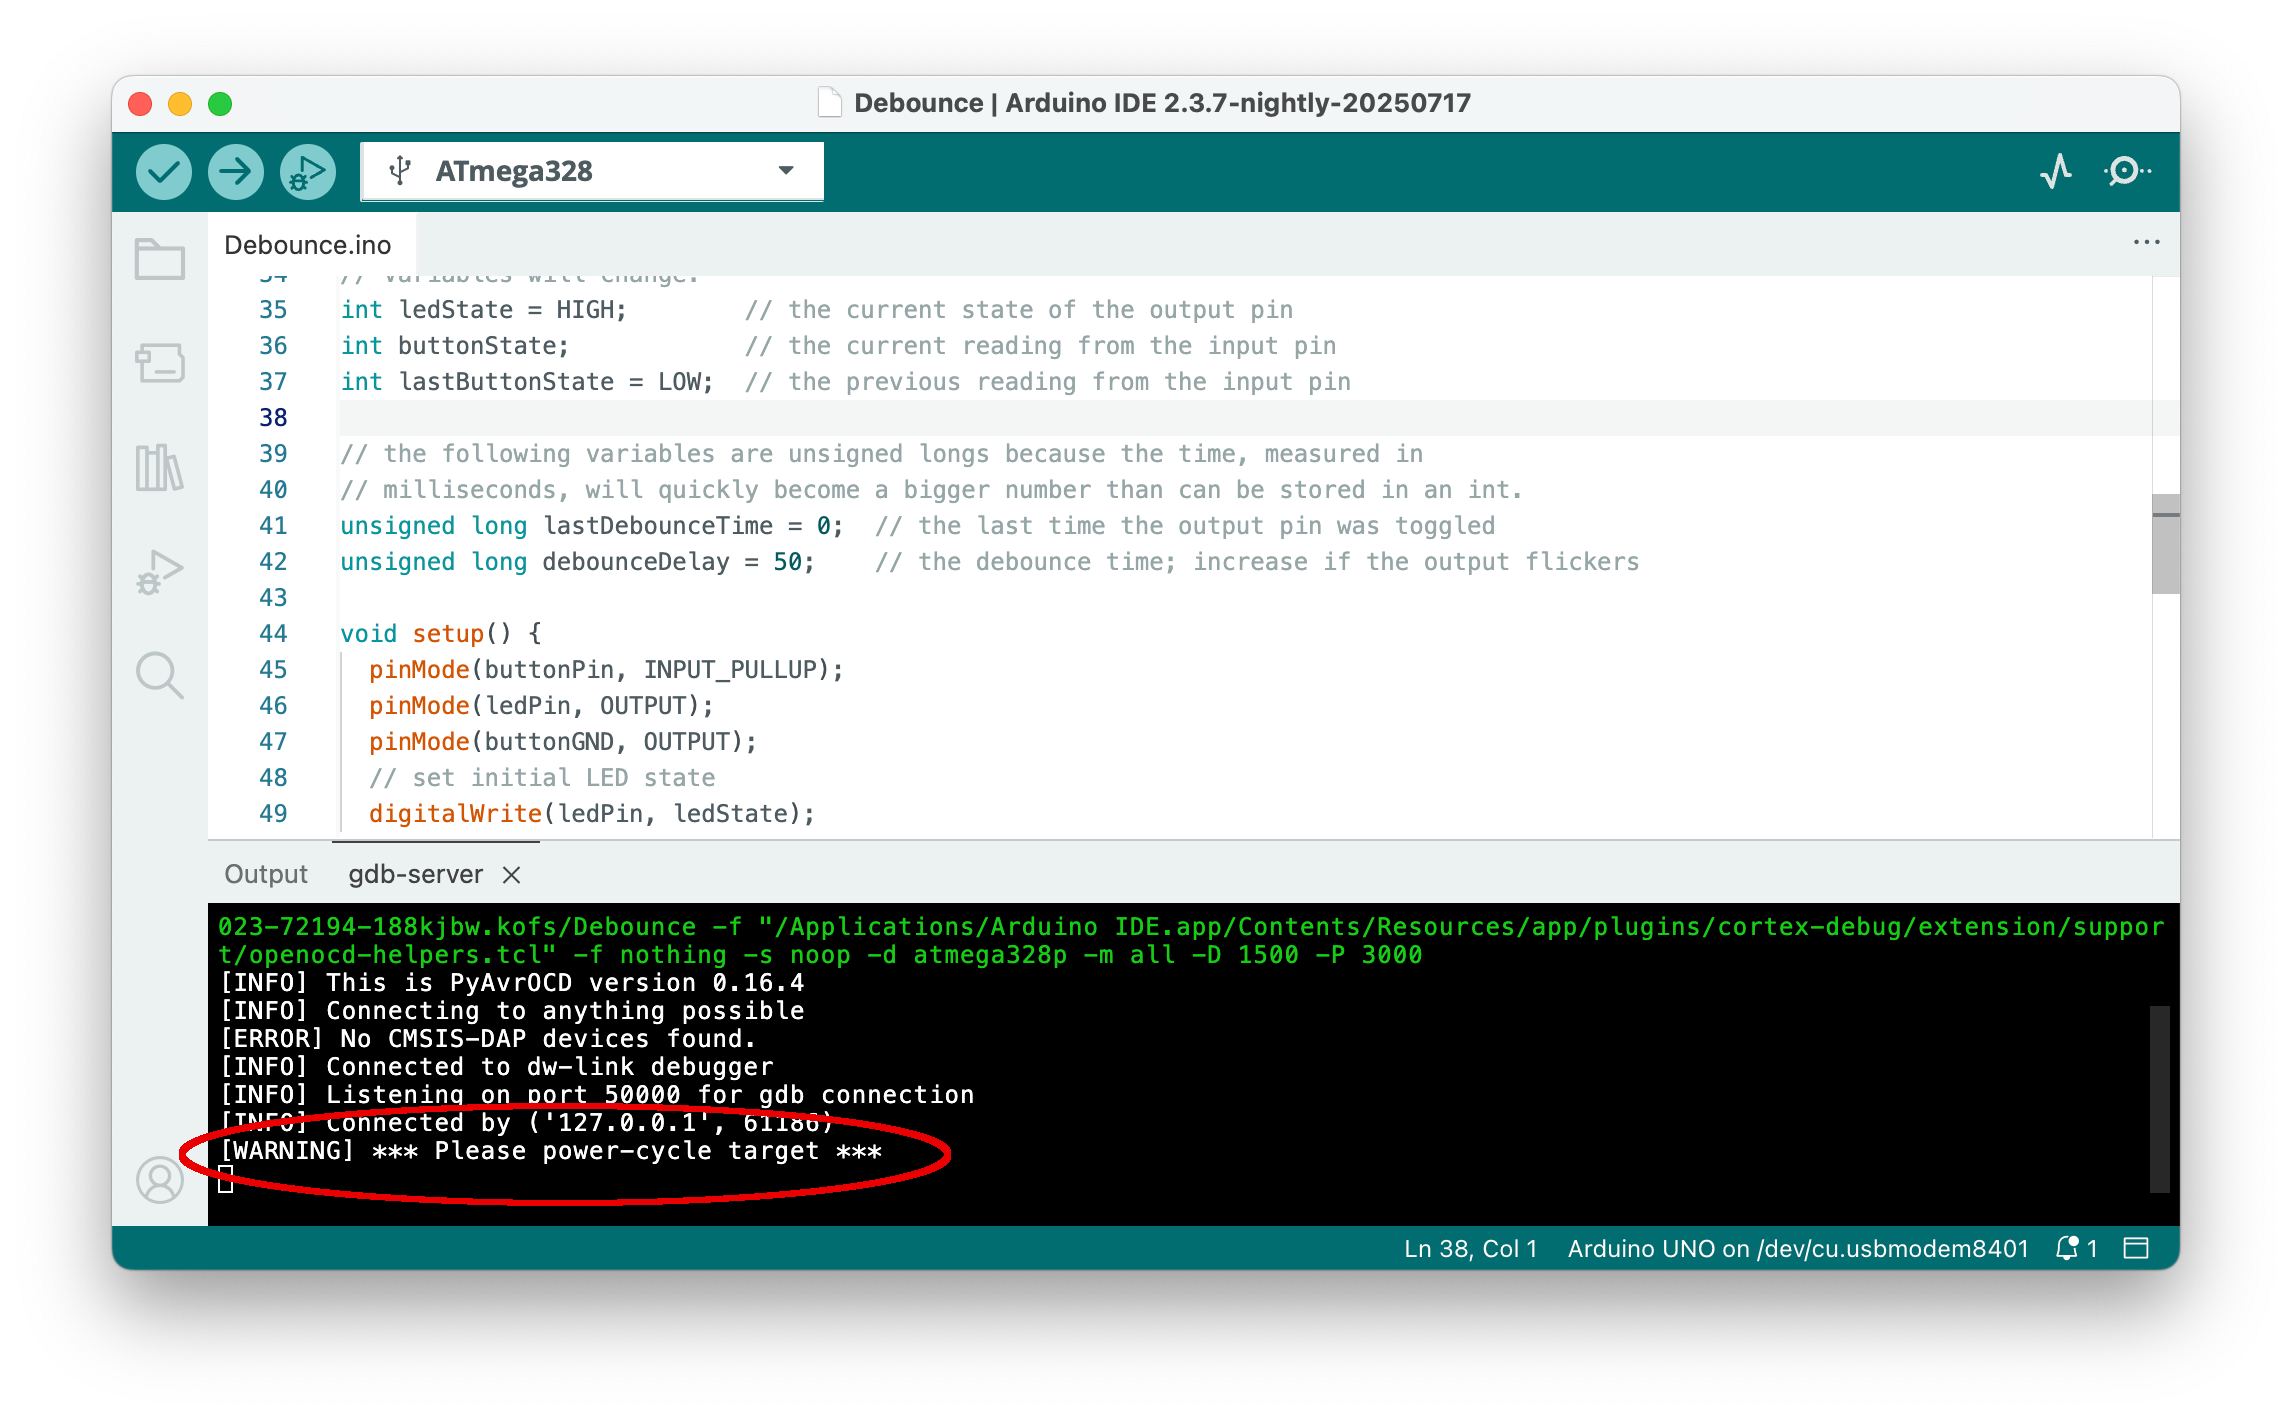
Power cycling means to remove the Vcc jumper cable and after a few seconds to reinsert it. After a while, the DEBUG pane should open.
Step 8: Debug the sketch
You can now start and stop execution, inspect variables, set breakpoints, and the like (see section on debugging). Clicking on the red square in the top bar of the DEBUG pane will terminate the current debugging episode.
Step 9: Start over or terminate the debugging session
After leaving the debugger, you can edit the sketch and start again at step 6. Note that you always have to recompile and restart the debugger before any changes you made to the sketch are effective.
Instead of starting a new edit/compile/debug cycle, you may want to end debugging. In this case, you should switch the MCU back from debugWIRE mode to normal mode, in which SPI programming is possible. In order to achieve that, type monitor debugwire disable into the prompt line of the Debug Console before ending the last debug episode.
It may also be a good idea to disable the Optimize for Debugging flag in the Sketch menu.
If you want to restore your Uno to the original state, consult the section on "Restoring the target."
Potential problems
If the status LED of dw-link starts to blink furiously, then the hardware debugger has hit an unrecoverable error. Typing monitor info into the input field of the GDB debugger can then help you find out about the error number, which is decoded in the Troubleshooting section.
It may also be a good idea to consult the Limitations section.
Quickstart: SNAP & ATtiny85
This quickstart guide demonstrates how to use the Arduino IDE 2 for debugging on an ATtiny85 using the MPLAB SNAP debug probe.
Required hardware
- SNAP
- USB cable
- ATtiny85 (or any other classic ATtiny or ATmegaX8) as the target
- In order to set up the target, you need:
- a breadboard together with
- jumper wires (male-to-male)
- 1 LED
- 2 resistors (10 kΩ, 1kΩ)
- 1 capacitor (100 nF)
Step 1: Install the debug-enabled TinyCore package
Add a new boards manager URL in the Preferences dialog:
https://mcudude.github.io/TinyCore/package_MCUdude_TinyCore_index.json
How to enter a new boards manager URL
First you need to open the Preferences dialog, which you find either in the Arduino IDE or the File menu.
Next you have to open the field Additional boards manager URLs.
Now type in the package index URL.
Finish the dialog by clicking on two OK buttons in succession.
Next, you have to install the new package. Activate the Boards Manager, select TinyCore, and click on Install.
How to install a new Arduino package or update an existing one
You need to activate the Boards Manager by clicking on the board symbol in the left side bar (1). After the boards manager pane has been opened, type part of the package's name into the search line (2). Then all packages with the search word in their description are displayed. Scroll down until you see the one you want to install (3). Install this package by clicking on Install (4). If the package is already installed, then an Update button will be shown that you need to click on.
Linux systems
After the installation, users of Linux systems will need to add udev rules. Download https://pyavrocd.io/99-edbg-debuggers.rules, edit if you want, and copy to /etc/udev/rules.d/.
Step 2: Connect the target with the debug probe
You need to set up the hardware on a breadboard and use a few jumper wires to connect the ATtiny to the debug probe. Further, as is obvious from the Fritzing sketch, you need an external power supply. Note that the notch or dot on the ATtiny is oriented towards the left.
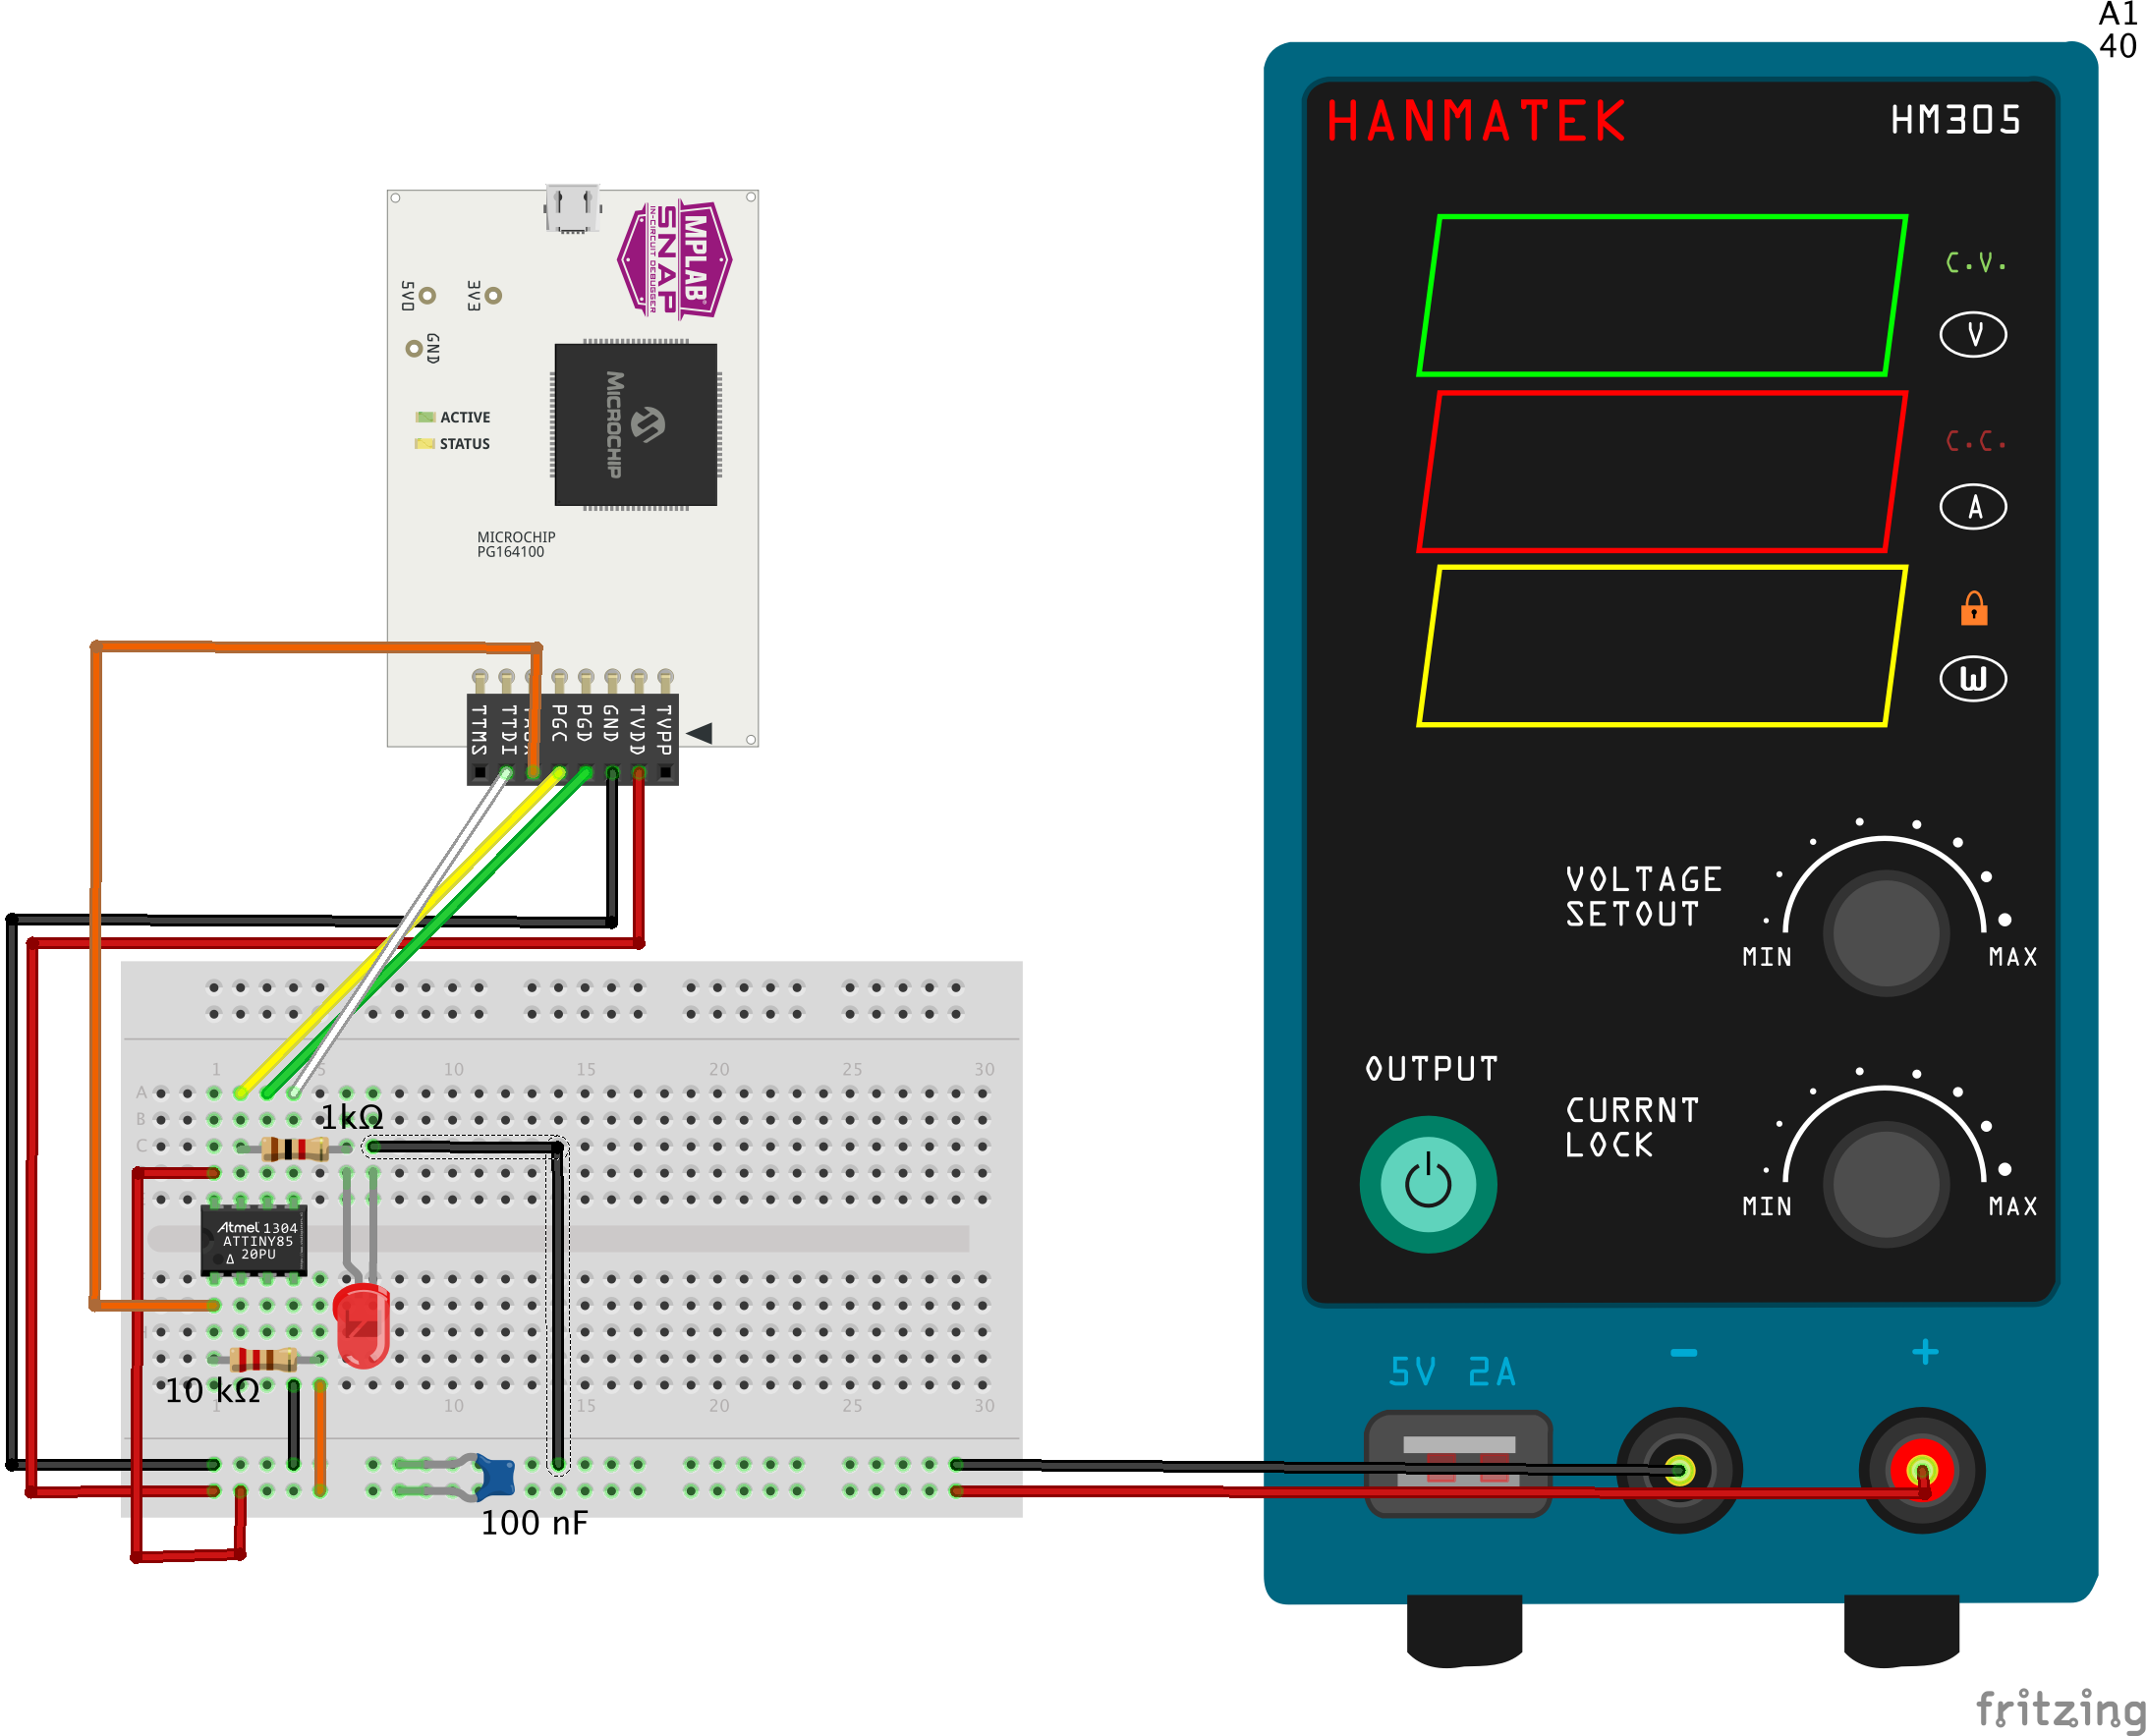
Table of breadboard connections
You can use this table to check whether you have made all the connections.
| ATtiny pin | SNAP pin | component |
|---|---|---|
| #1 (Reset) | TAUX #6 | 10 kΩ resistor to Vcc |
| #2 (D3) | ||
| #3 (D4) | ||
| #4 (GND) | GND #3 | GND on breadboard, LED (-), decoupling cap 100 nF |
| #5 (D0, MOSI) | TTDI #7 | |
| #6 (D1, MISO) | PGD #4 | |
| #7 (D2, SCK) | PGC #5 | 1 kΩ resistor to LED (+) |
| #8 (Vcc) | TVDD #2 | Vcc on breadboard, 10k resistor, decoupling cap 100 nF |
| connect LED (+) and 1 kΩ resistor |
Step 3: Load sketch and select board
Load a sketch, e.g., the Blink sketch, and select the right board: Tools -> Board -> TinyCore -> ATtiny85. If this is a chip is fresh from the factory, you need to adjust for the clock frequency. Choose 1 MHz internal osc. under Tools -> Clock.
Step 4: Compile the sketch
Activate Optimize for Debugging in the Sketch menu. This only needs to be done once. Then click on the Verify button (checkmark symbol) in the top bar. This will compile the sketch.
Step 5: Start debugging
Now it is time to start debugging by clicking the Debug button (bug in front of a triangle) in the top bar. If the target MCU is not already in debugWIRE mode, the debugger will request 'power cycling'.
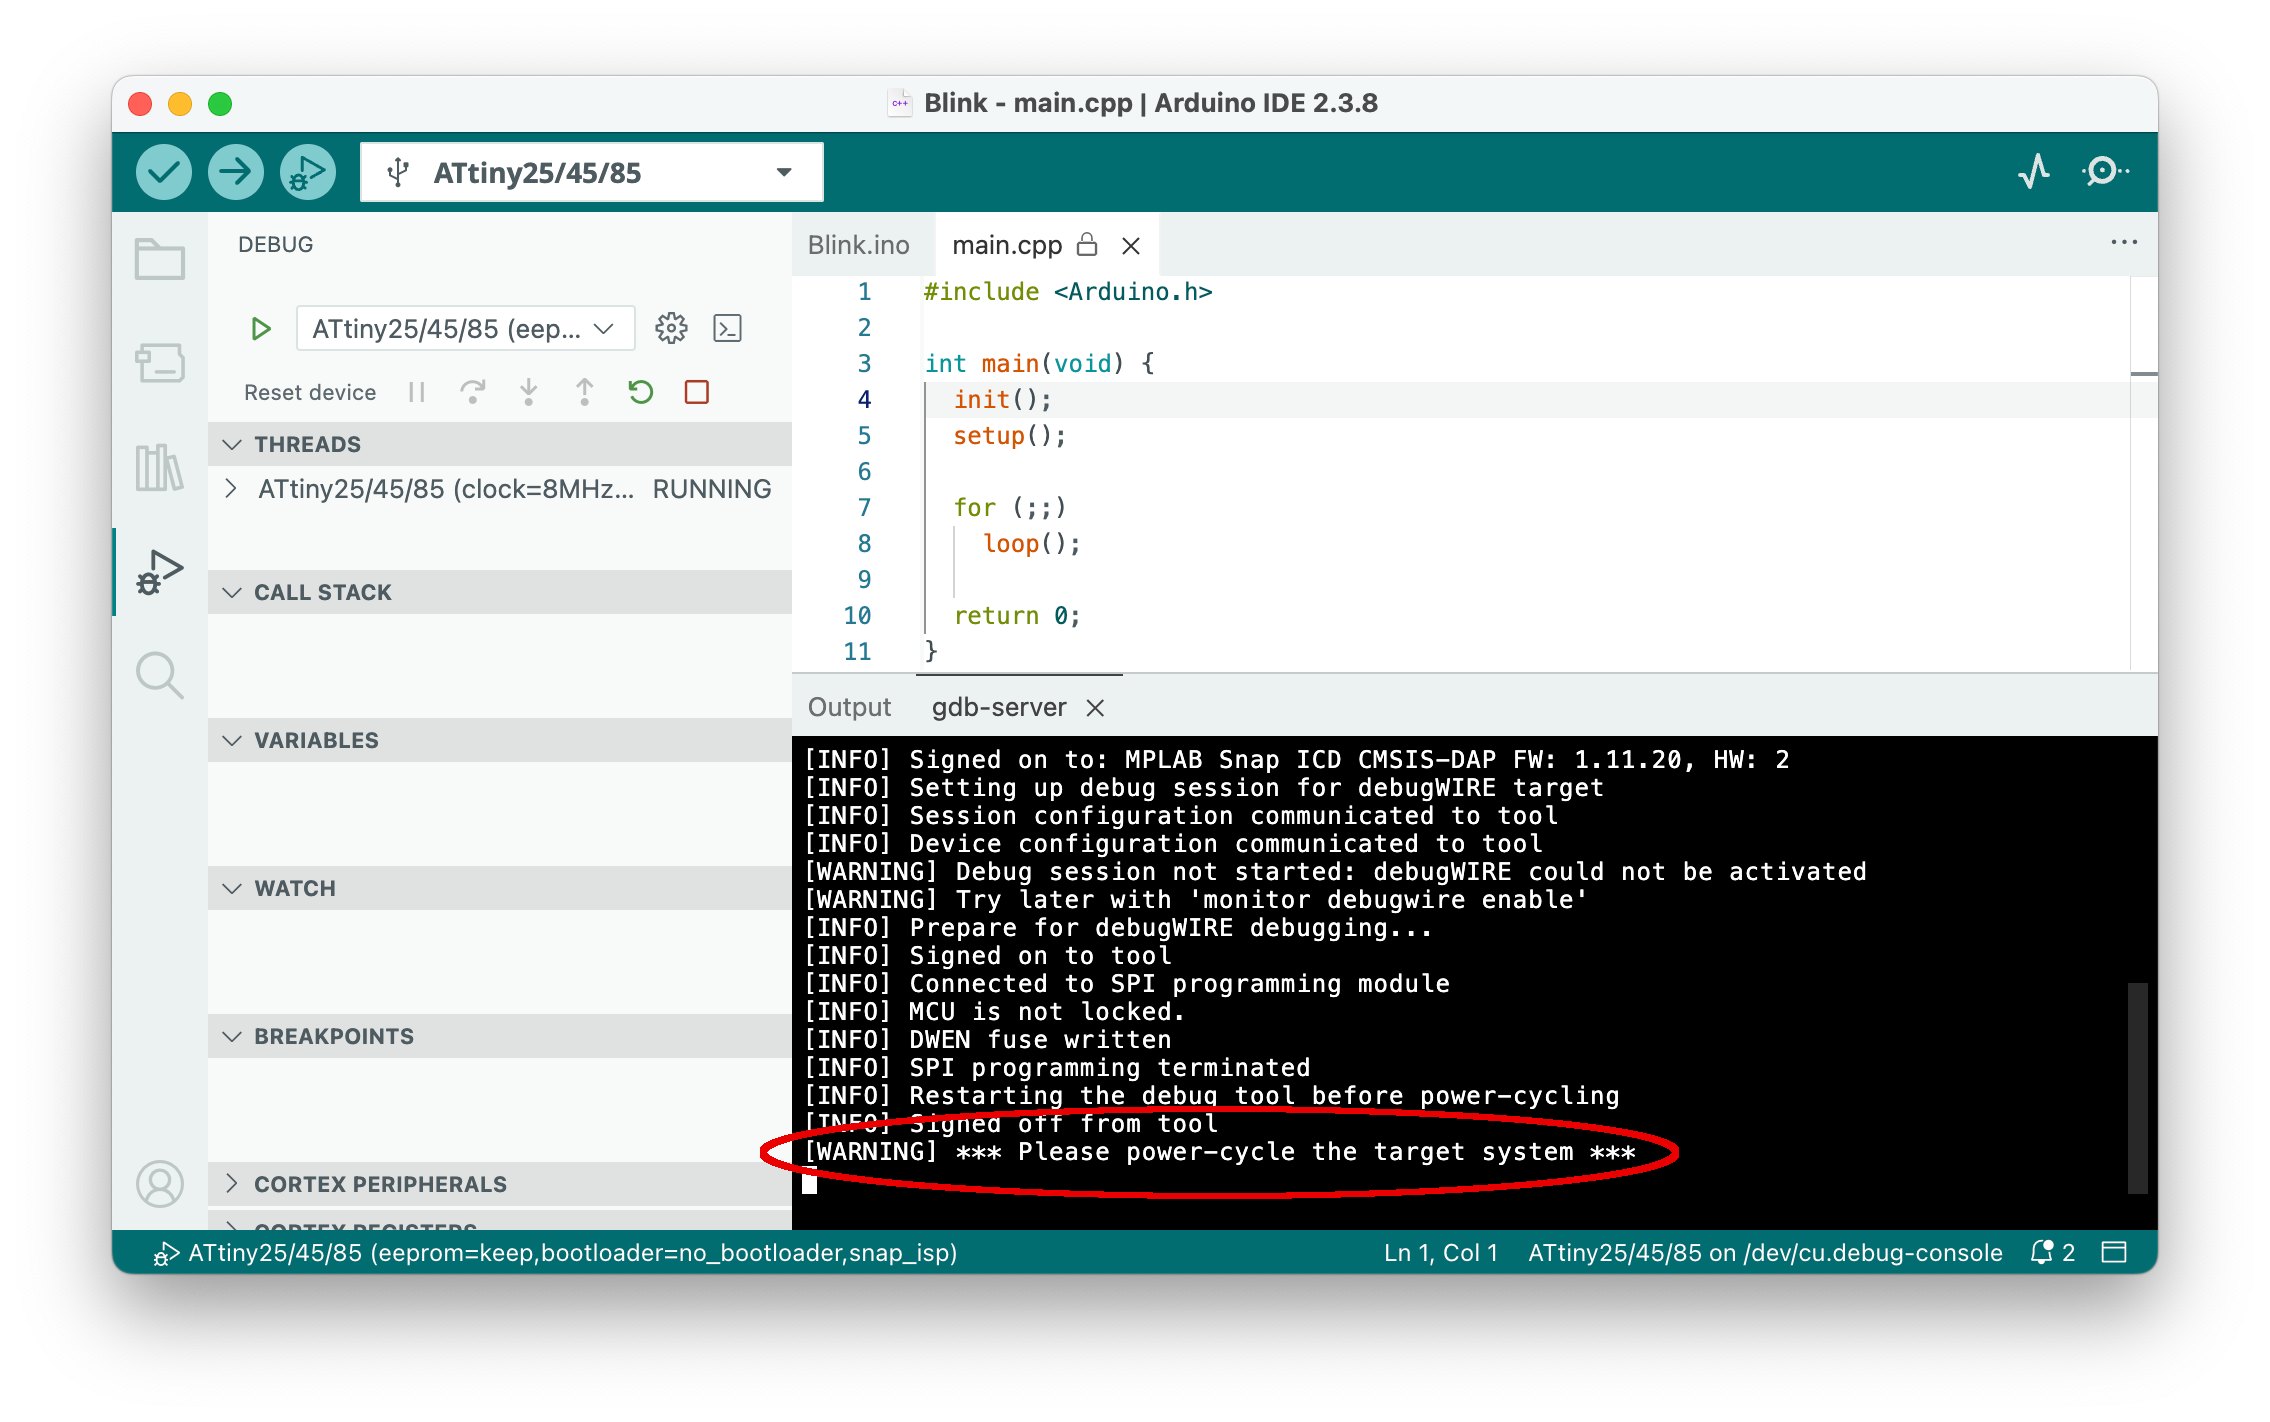
Power cycling means to remove the Vcc jumper cable and, after a few seconds, to reinsert it. After a while, the DEBUG pane should open.
Step 8: Debug the sketch
You can now start and stop execution, inspect variables, set breakpoints, and the like (see section on debugging). Clicking on the red square in the top bar of the DEBUG pane will terminate the current debugging episode.
Step 9: Start over or terminate the debugging session
After leaving the debugger, you can edit the sketch and start again at step 4. Note that you always have to recompile and restart the debugger before any changes you made to the sketch are effective.
Instead of starting a new edit/compile/debug cycle, you may want to end debugging. In this case, you should switch the MCU back from debugWIRE mode to normal mode, in which SPI programming is possible. In order to achieve that, type monitor debugwire disable into the prompt line of the Debug Console before ending the last debug episode. It may also be a good idea to disable the Optimize for Debugging flag in the Sketch menu.
What can go wrong?
There is always the chance that something goes south, either debugging does not start at all, or something funny happens while debugging. If so, it is a good idea to have a look at the output in the gdb-server console. Messages with the prefix [CRITICAL] often tell what went wrong. It may also be a good idea to consult the Troubleshooting and the Limitations sections.
-
You actually will need to add only one of these URLs which depends on the MCU on the board. ↩