Quickstart Guides: Arduino IDE 2
Since PyAvrOCD is integrated into the Arduino IDE 2, it is pretty easy to start debugging. In general, the following steps have to be performed:
- Install a debug-enabled core (see list of debug-enabled Arduino cores).
- Perhaps some changes on the board are necessary, e.g., disconnecting some components or opening a solder bridge.
- On JTAG targets, you may need to enable the JTAG pins.
- Connect the target board to the debugger.
- Start debugging!
- Restore the board by using the
Burn Bootloaderaction and reconnect disconnected components and/or re-solder the opened solder bridge.
The following two quickstart guides should pave the way to AVR debugging in the Arduino IDE 2:
- Debugging using the ATmega328P Xplained Mini board, which has an Arduino UNO footprint, is very care-free because the debugger is already on the board. So, no board preparations or connections are necessary.
- Debugging using the dw-link debugger lowers the entry to serious embedded debugging because the debug probe is an Arduino UNO.
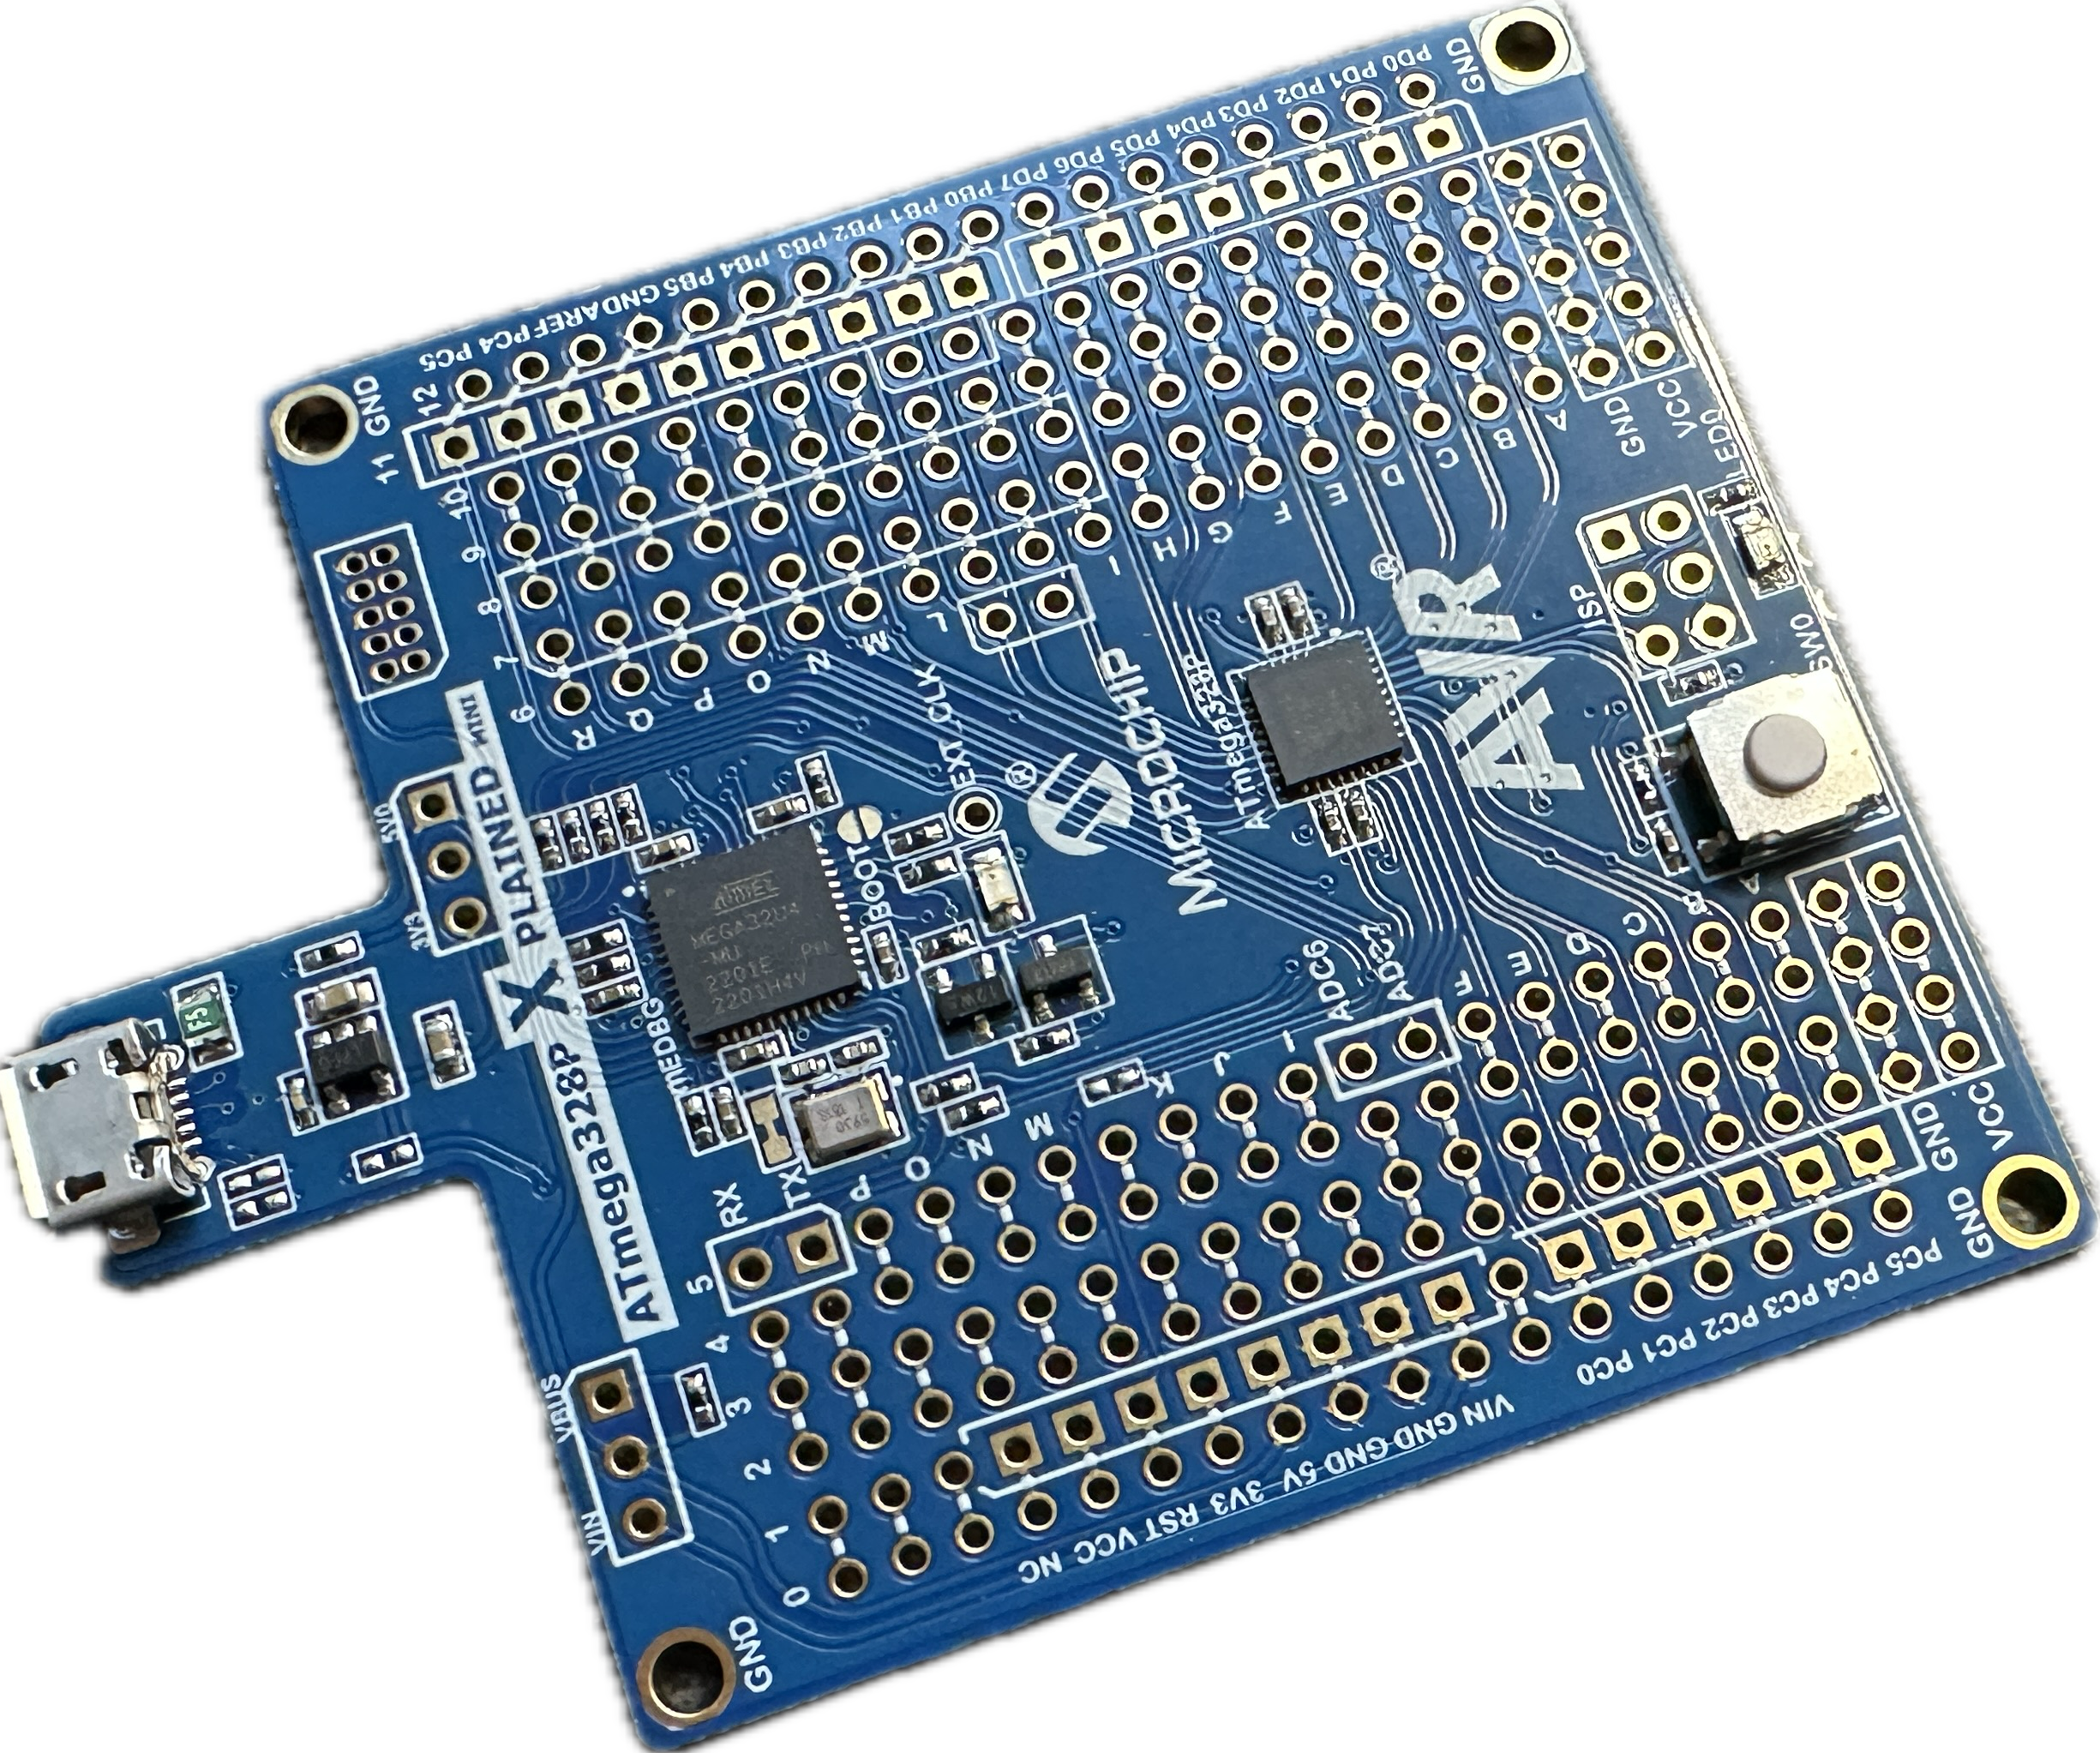
Quickstart guide: ATmega328P Xplained Mini
This quickstart guide explains how to set up the Arduino IDE 2 so that you can use its debugging feature on an Atmega328P Xplained Mini board. This development board is ideal for making a first experience with embedded debugging because it already contains an onboard debugger. This means you do not have to bother with preparing the board for debugging, connecting the debug probe to the board, choosing a programmer/debugger, and setting the proper fuses. It is simply plug-and-play. In addition, this development board has an Arduino UNO R3 footprint. If you solder headers (at the right place) on the board, then it is possible to plug ordinary Uno shields into the headers. And if you need more I/O power, there is also an Xplained Mini board with the ATmega328PB for the same price. By the way, these boards are not overly expensive.
Required hardware
The only thing you need is the XPlained Mini board and a USB cable to connect it to your computer.
Step 1: Extend the list of boards manager URLs
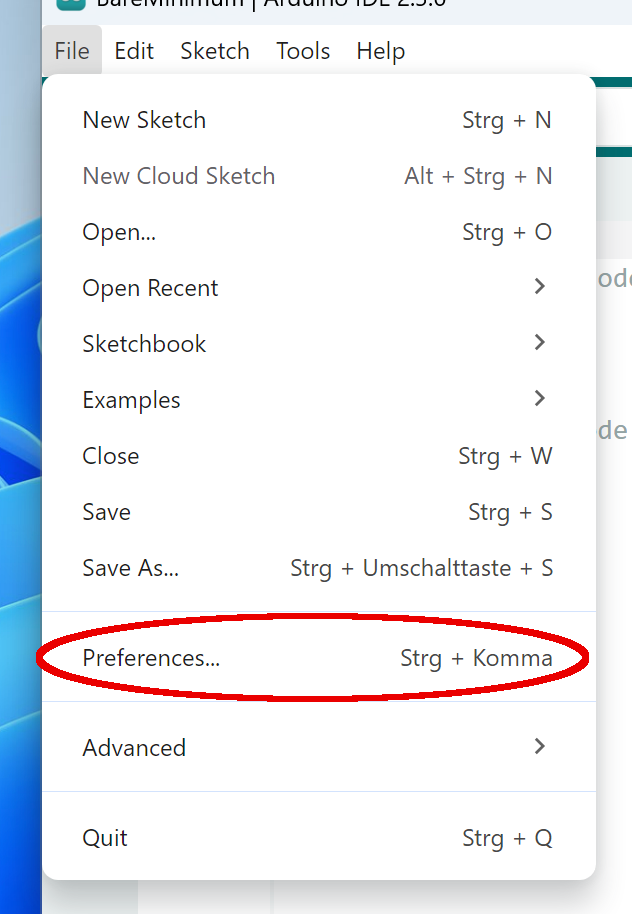
Assuming that you have already installed the Arduino IDE 2, you first have to extend the list of Additional boards manager URLs. Start the Preferences dialog, which you find, depending on your operating system, either in the Arduino IDE or the File menu.
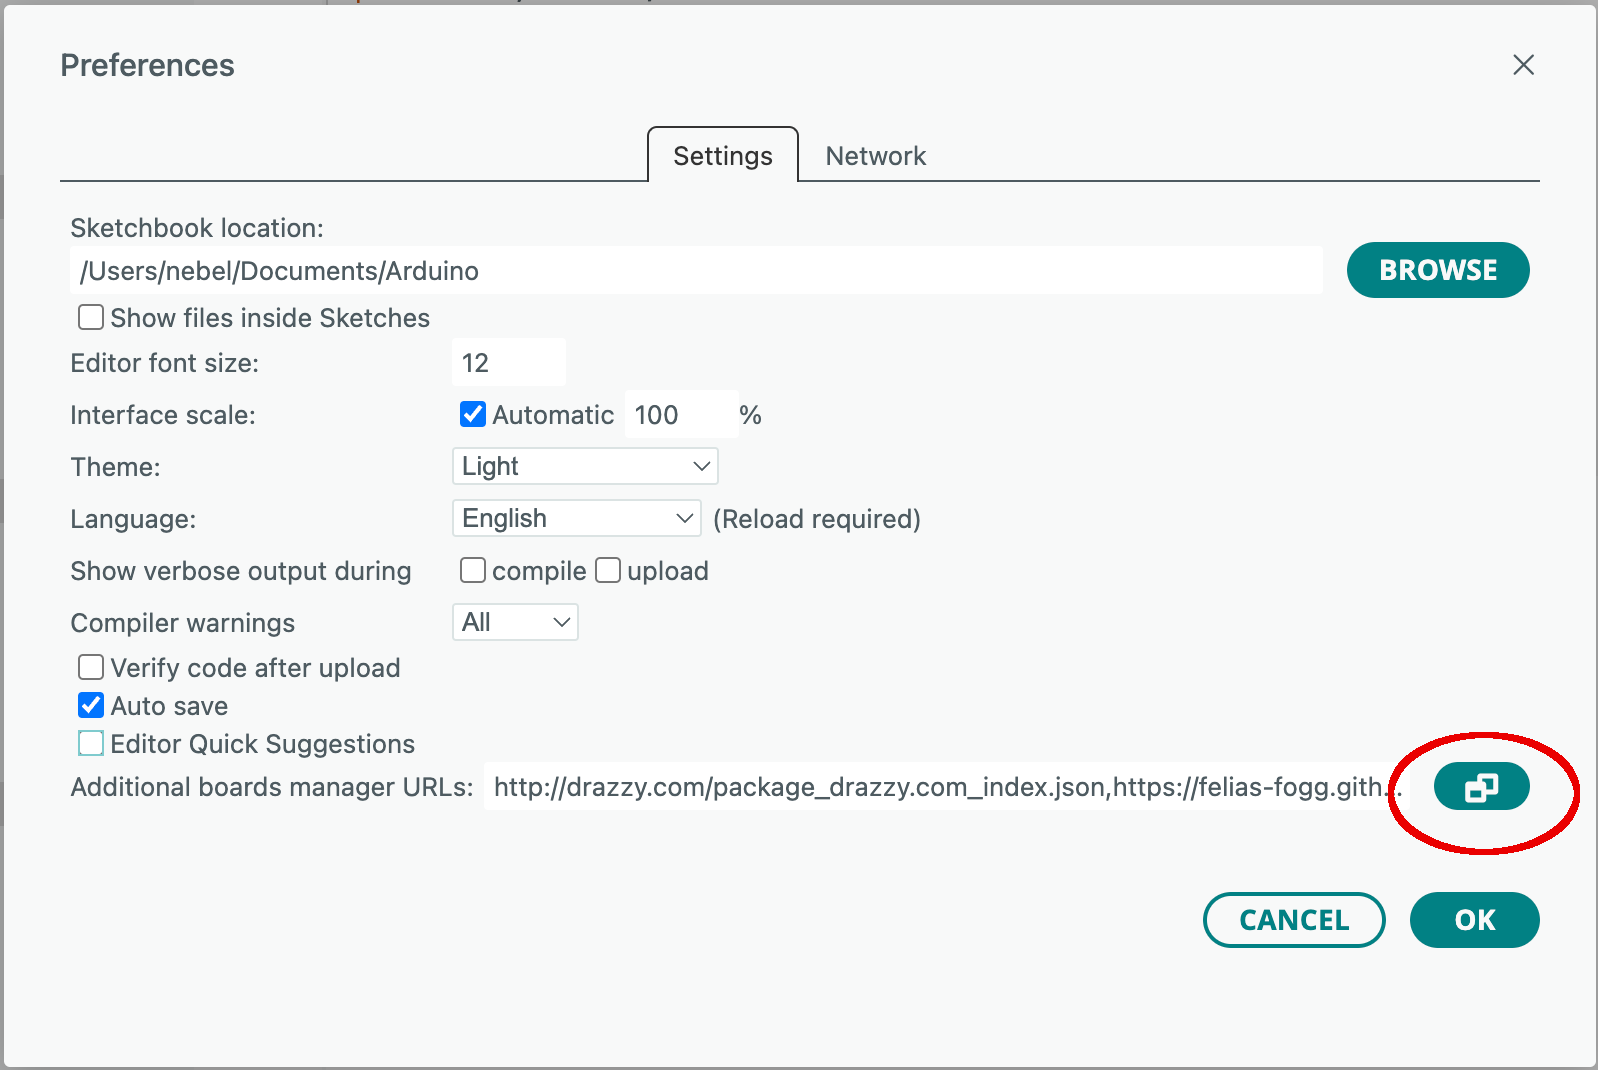
Now select the field with the additional board manager URLs.
Type the following URL into a new line:
https://downloads.pyavrocd.io/package_debug_enabled_index.json
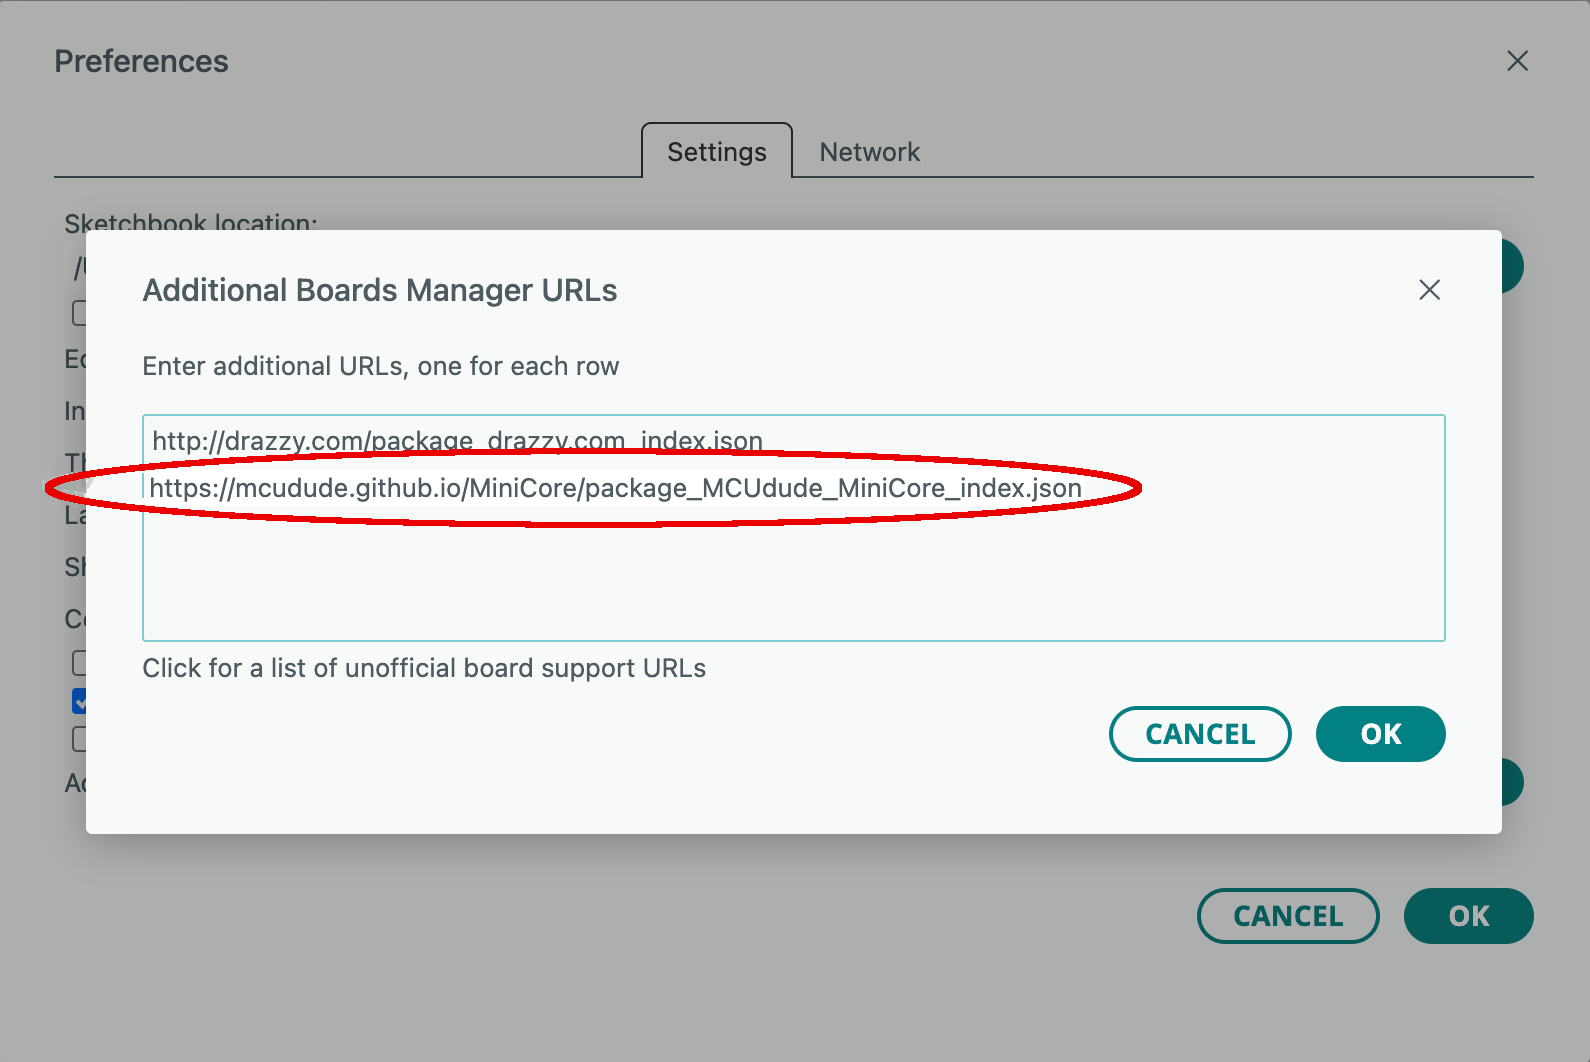
You close the dialog by clicking on two OK buttons in succession.
Step 2: Install a debug-enabled core
Now you need to activate the boards manager by clicking on the board symbol in the left side bar (1). After the boards manager pane has been opened, type "Debug" into the search line (2). After that, all cores with the word "Debug" in their description are displayed. Scroll down until you see one with the title "Atmel AVR Xplained-minis (Debug enabled)." Install this core by clicking on Install (3).
Loading the core and all the necessary tools might take a while.
Linux systems
After the installation, users of Linux systems will need to add udev rules. Download https://pyavrocd.io/99-edbg-debuggers.rules, edit if you want, and copy to /etc/udev/rules.d/.
Step 3: Connect the board and select the board type and port in the boards manager
In our case, connecting the target board to the host consists simply of plugging the USB cable into the board. After that, you have to select the right board and serial line in the IDE. First, click on Select Board in the top bar and choose Select other board and port ....
Then type "328" in the search field (1), select the right board (2), the correct port (3), and finally click the OK button.
The debugging icon in the top row is no longer greyed out. In other words, you have unleashed the power of the Arduino debugger at this point.
Step 4: Edit and compile a sketch
Let us choose a simple sketch that is a little bit more challenging than the Blink example. The Debounce example will do. Let us load it and modify it for our needs.
This sketch will toggle the LED state (on pin 13) when a button is pressed. The program logic contains a basic form of debouncing so that noise induced by the button contact opening and closing is ignored. The button in this sketch is supposed to be at digital input line 2. The xmini, however, has such a button at digital input line 21. For this reason, we have to change line 31 of the sketch as follows:
const int buttonPin = 21; // the number of the pushbutton pin
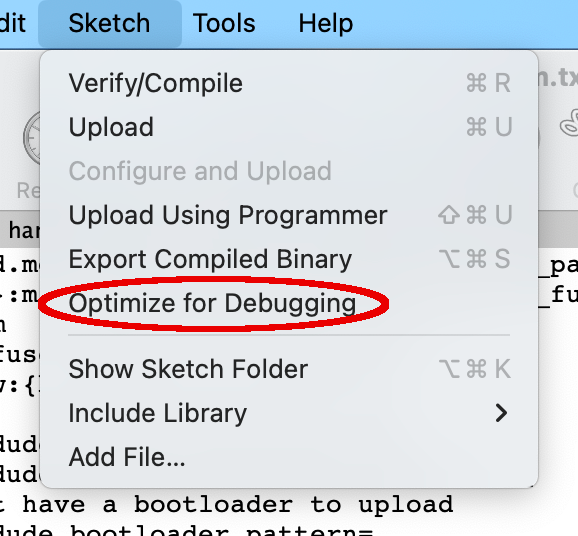
Before compiling and uploading the sketch, you should set the Optimize for Debugging flag in the Sketch menu. This flag will make sure that the produced machine code resembles the program flow in the source code in order to make debugging easier.
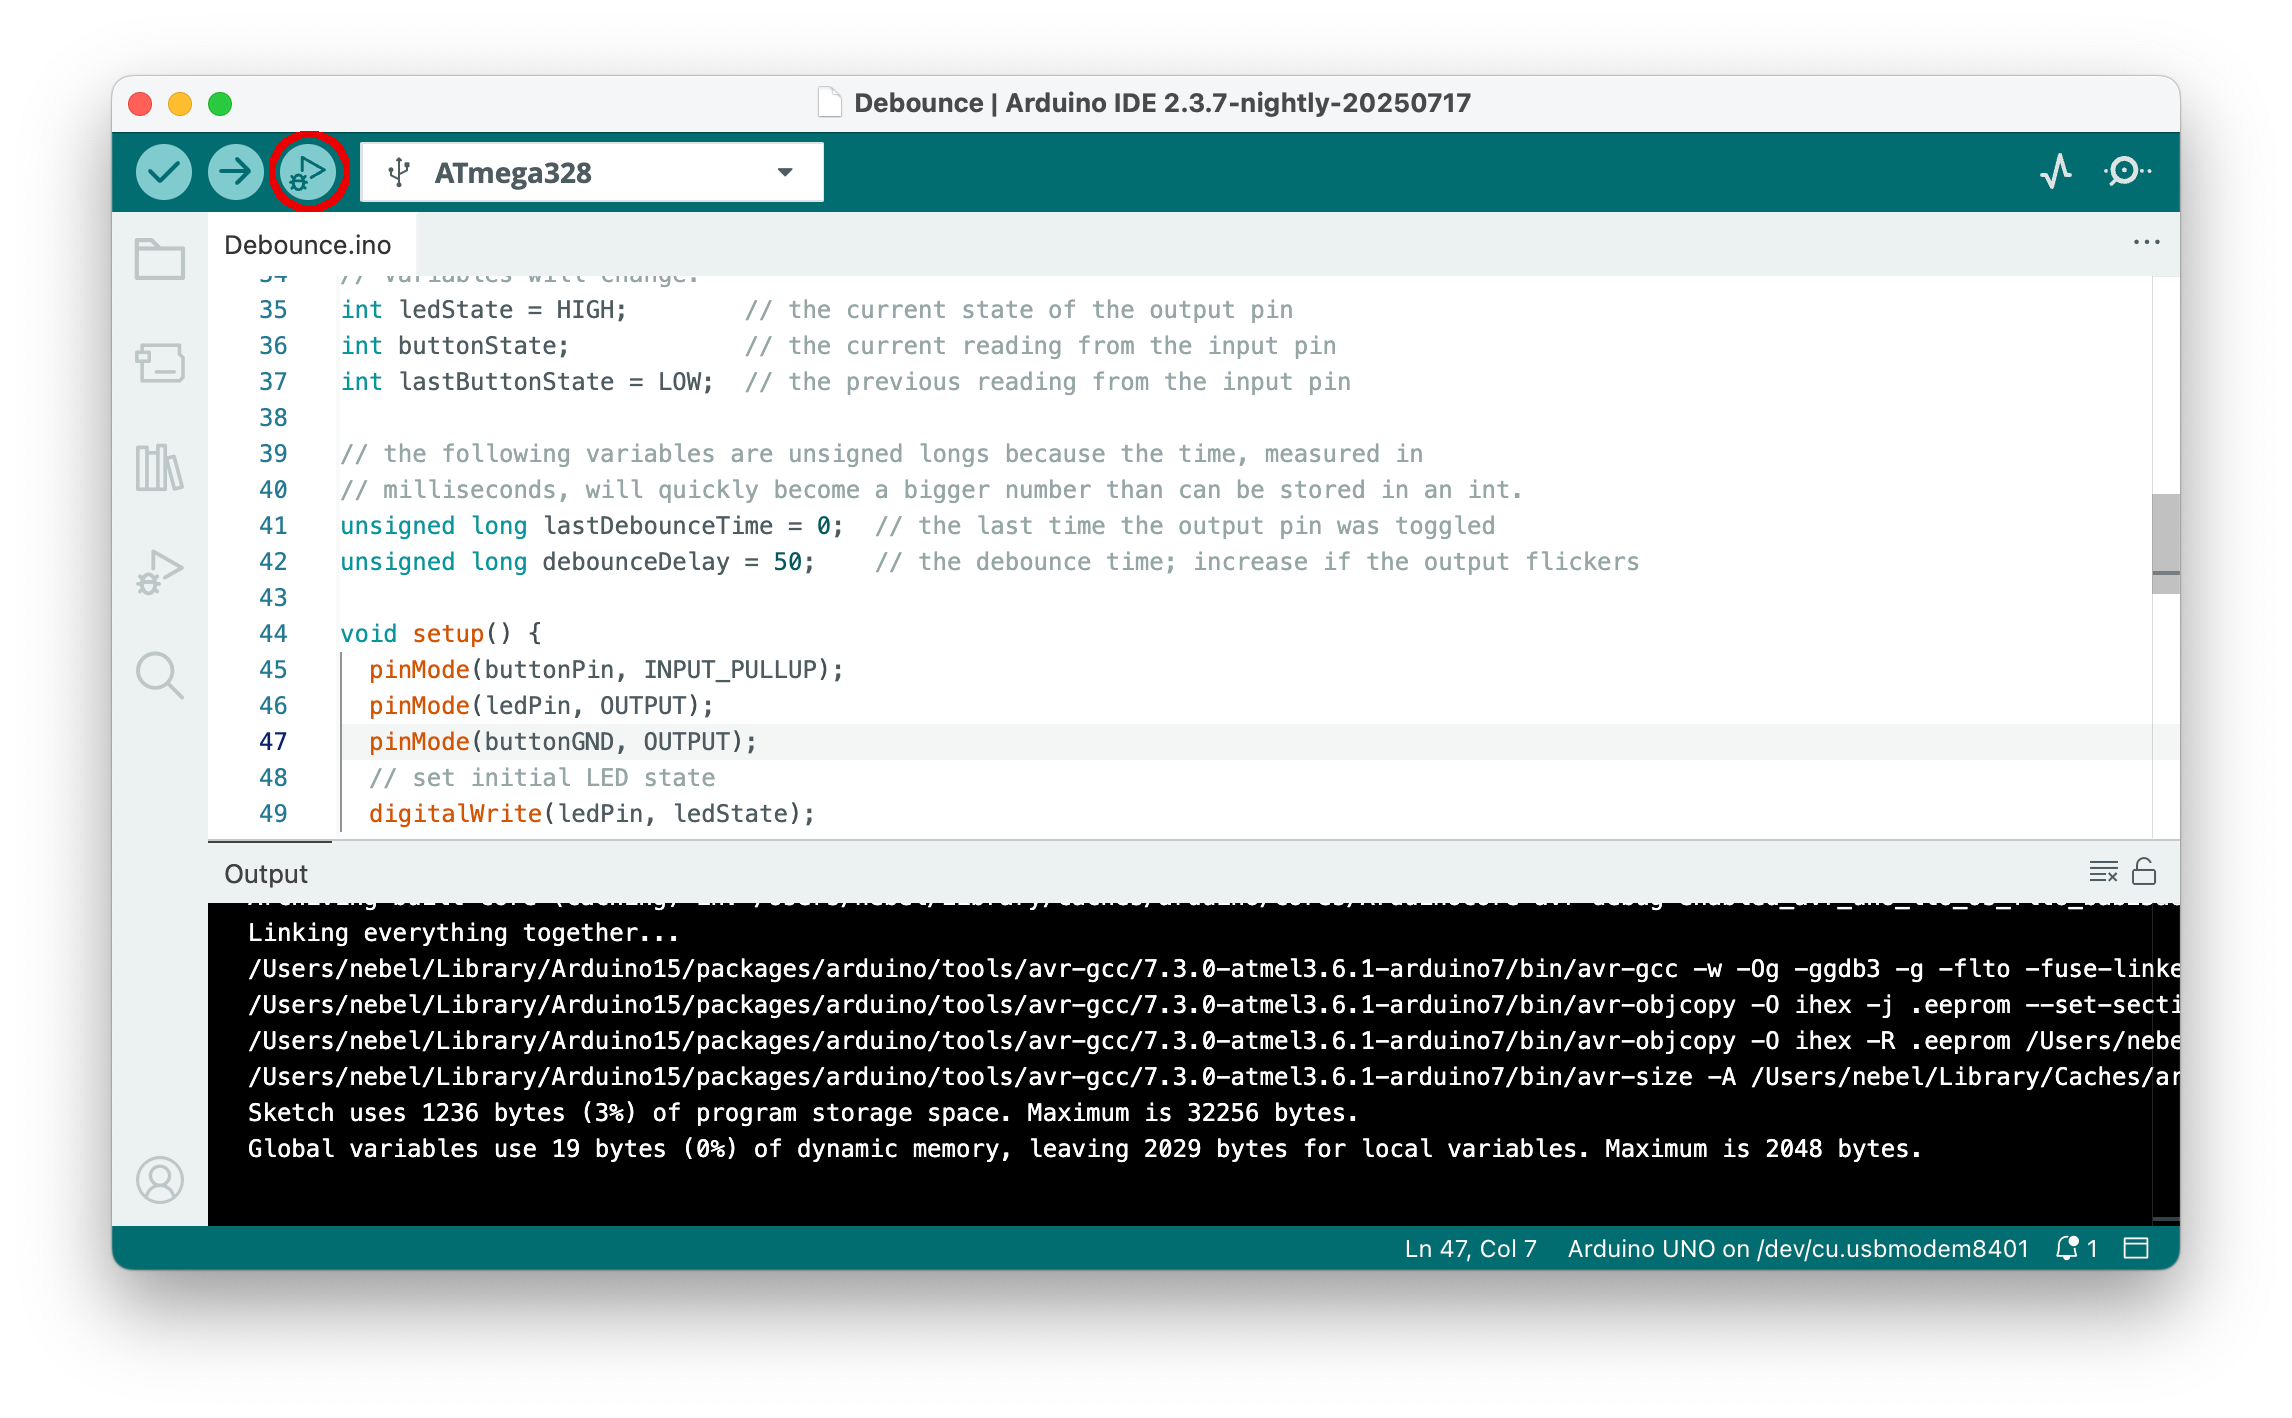
Now it is time to compile the sketch. Click the Verify button (a check mark symbol) in the top bar, which will compile the sketch. Loading the compiled code will then be done when the debugger is started. Instead, you can click on the Upload button (the right arrow symbol), which will compile and upload the code. In the case of the Xmini development board, this is the preferred way because it results in an overall faster upload time.
Step 5: Debug the sketch
Now it is time to start debugging by clicking the Debug button (bug in front of a triangle) in the top row.
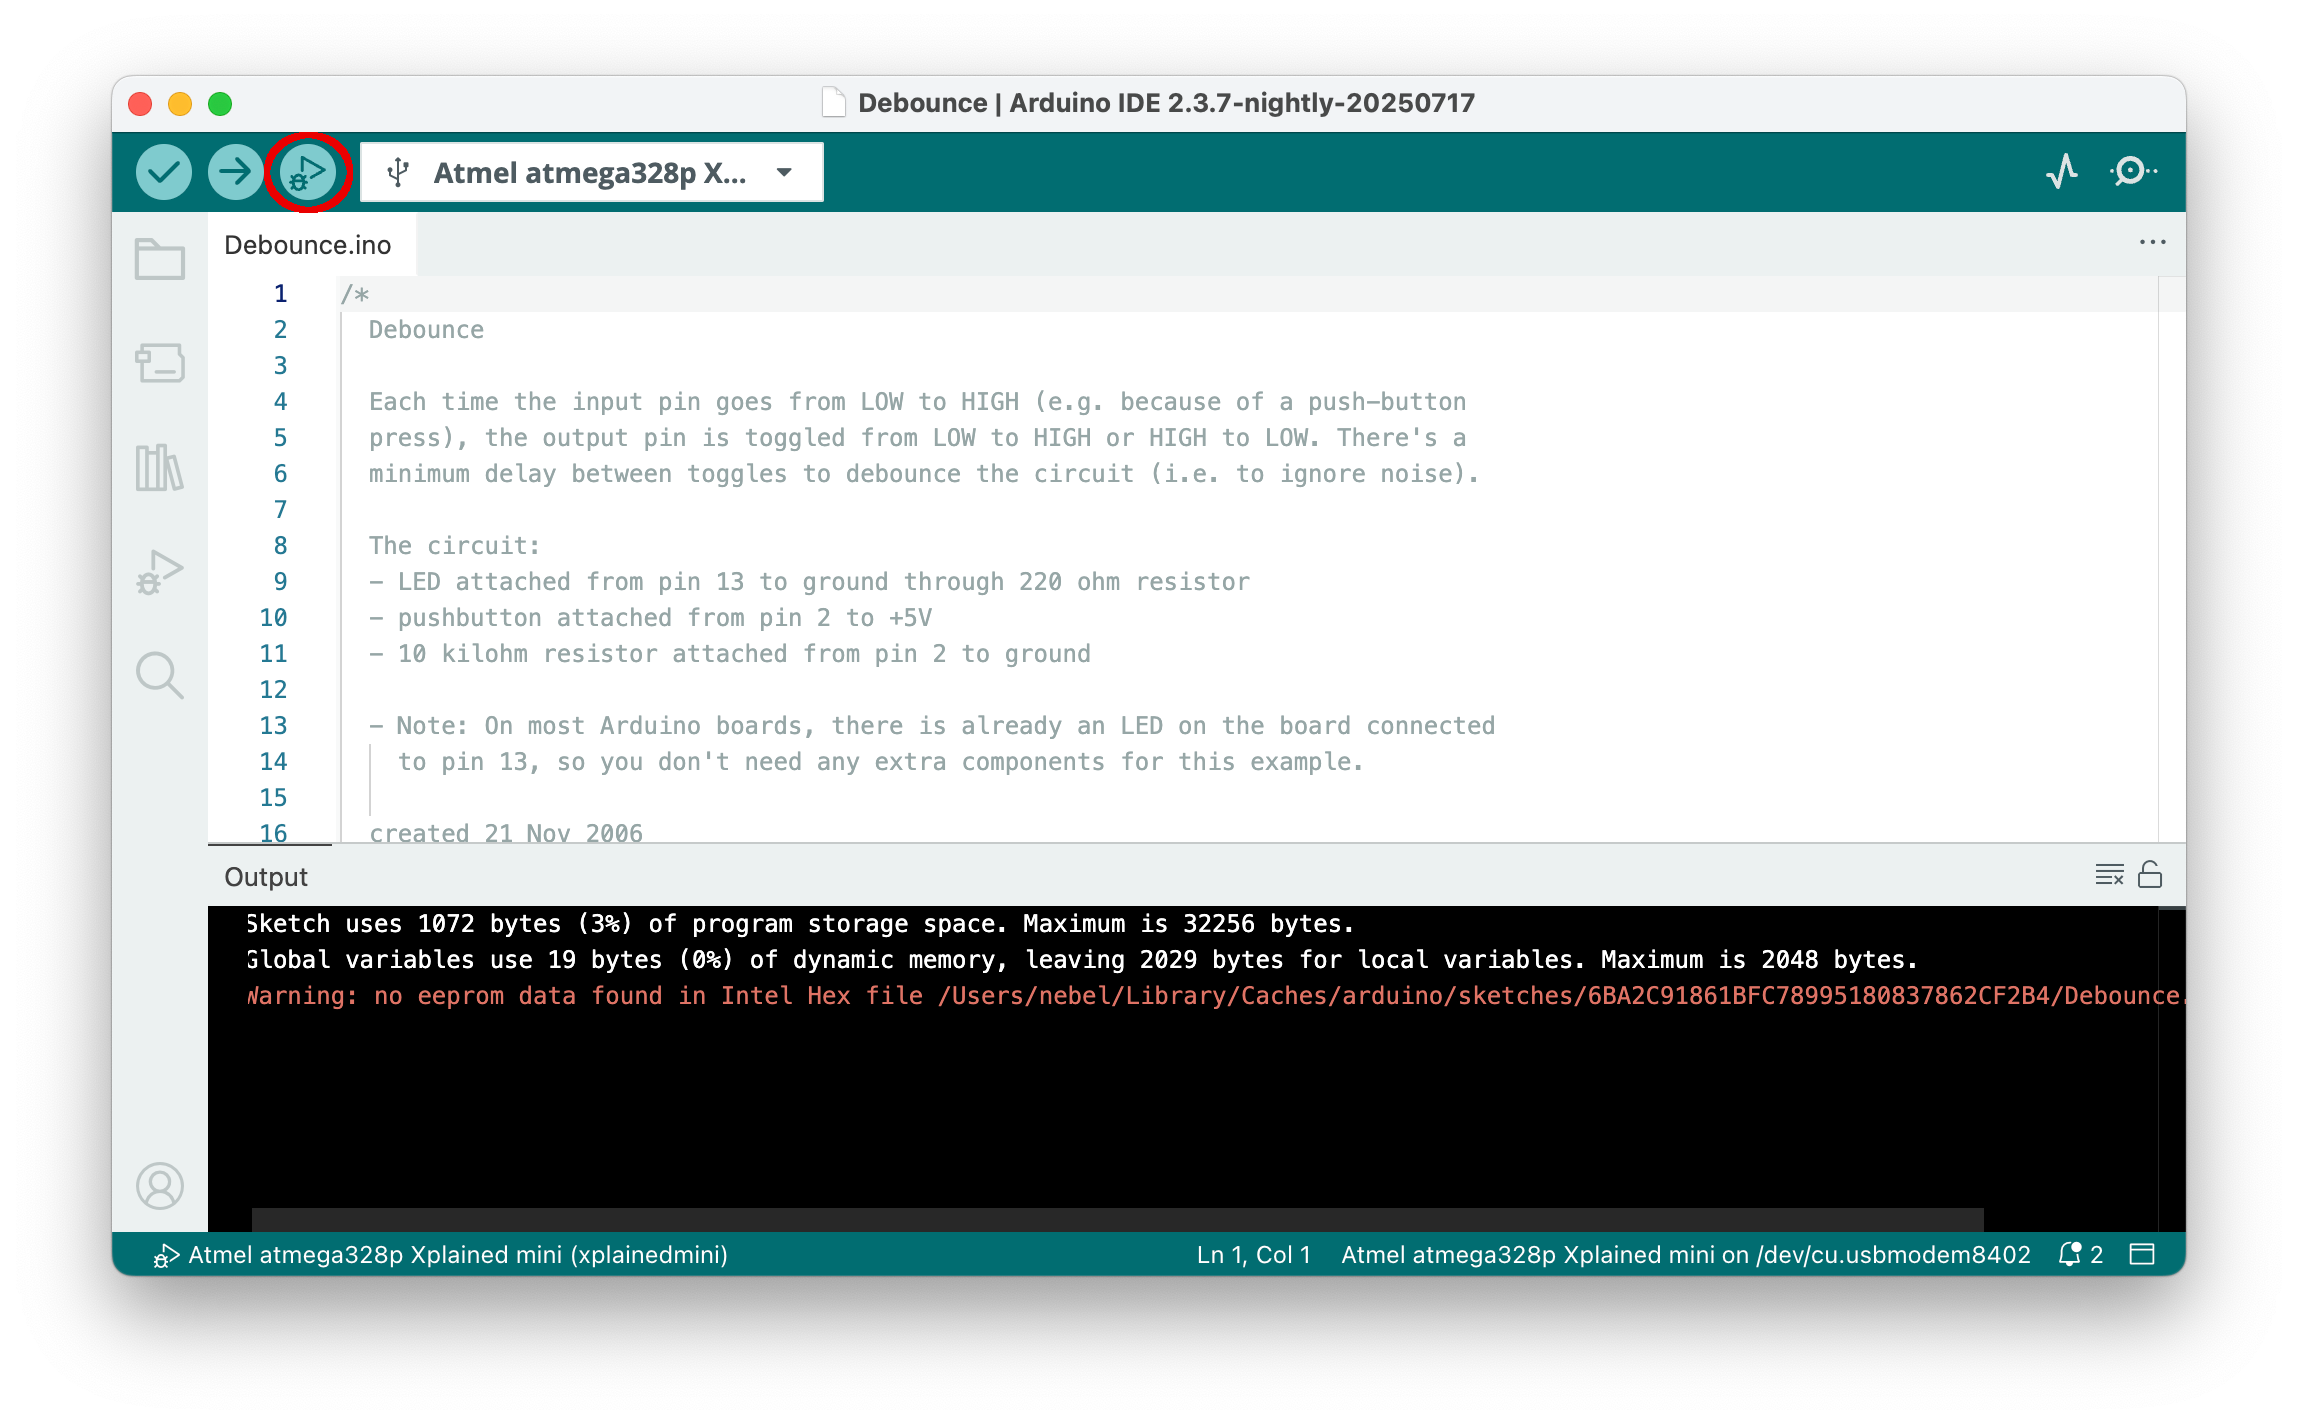
This will trigger a lot of actions. First, the debug pane to the left of the sketch editor pane will be opened. Second, below the sketch editor pane, first a gdb-server console will appear, then the Debug Console. While this is happening, the sketch is loaded and execution is started.
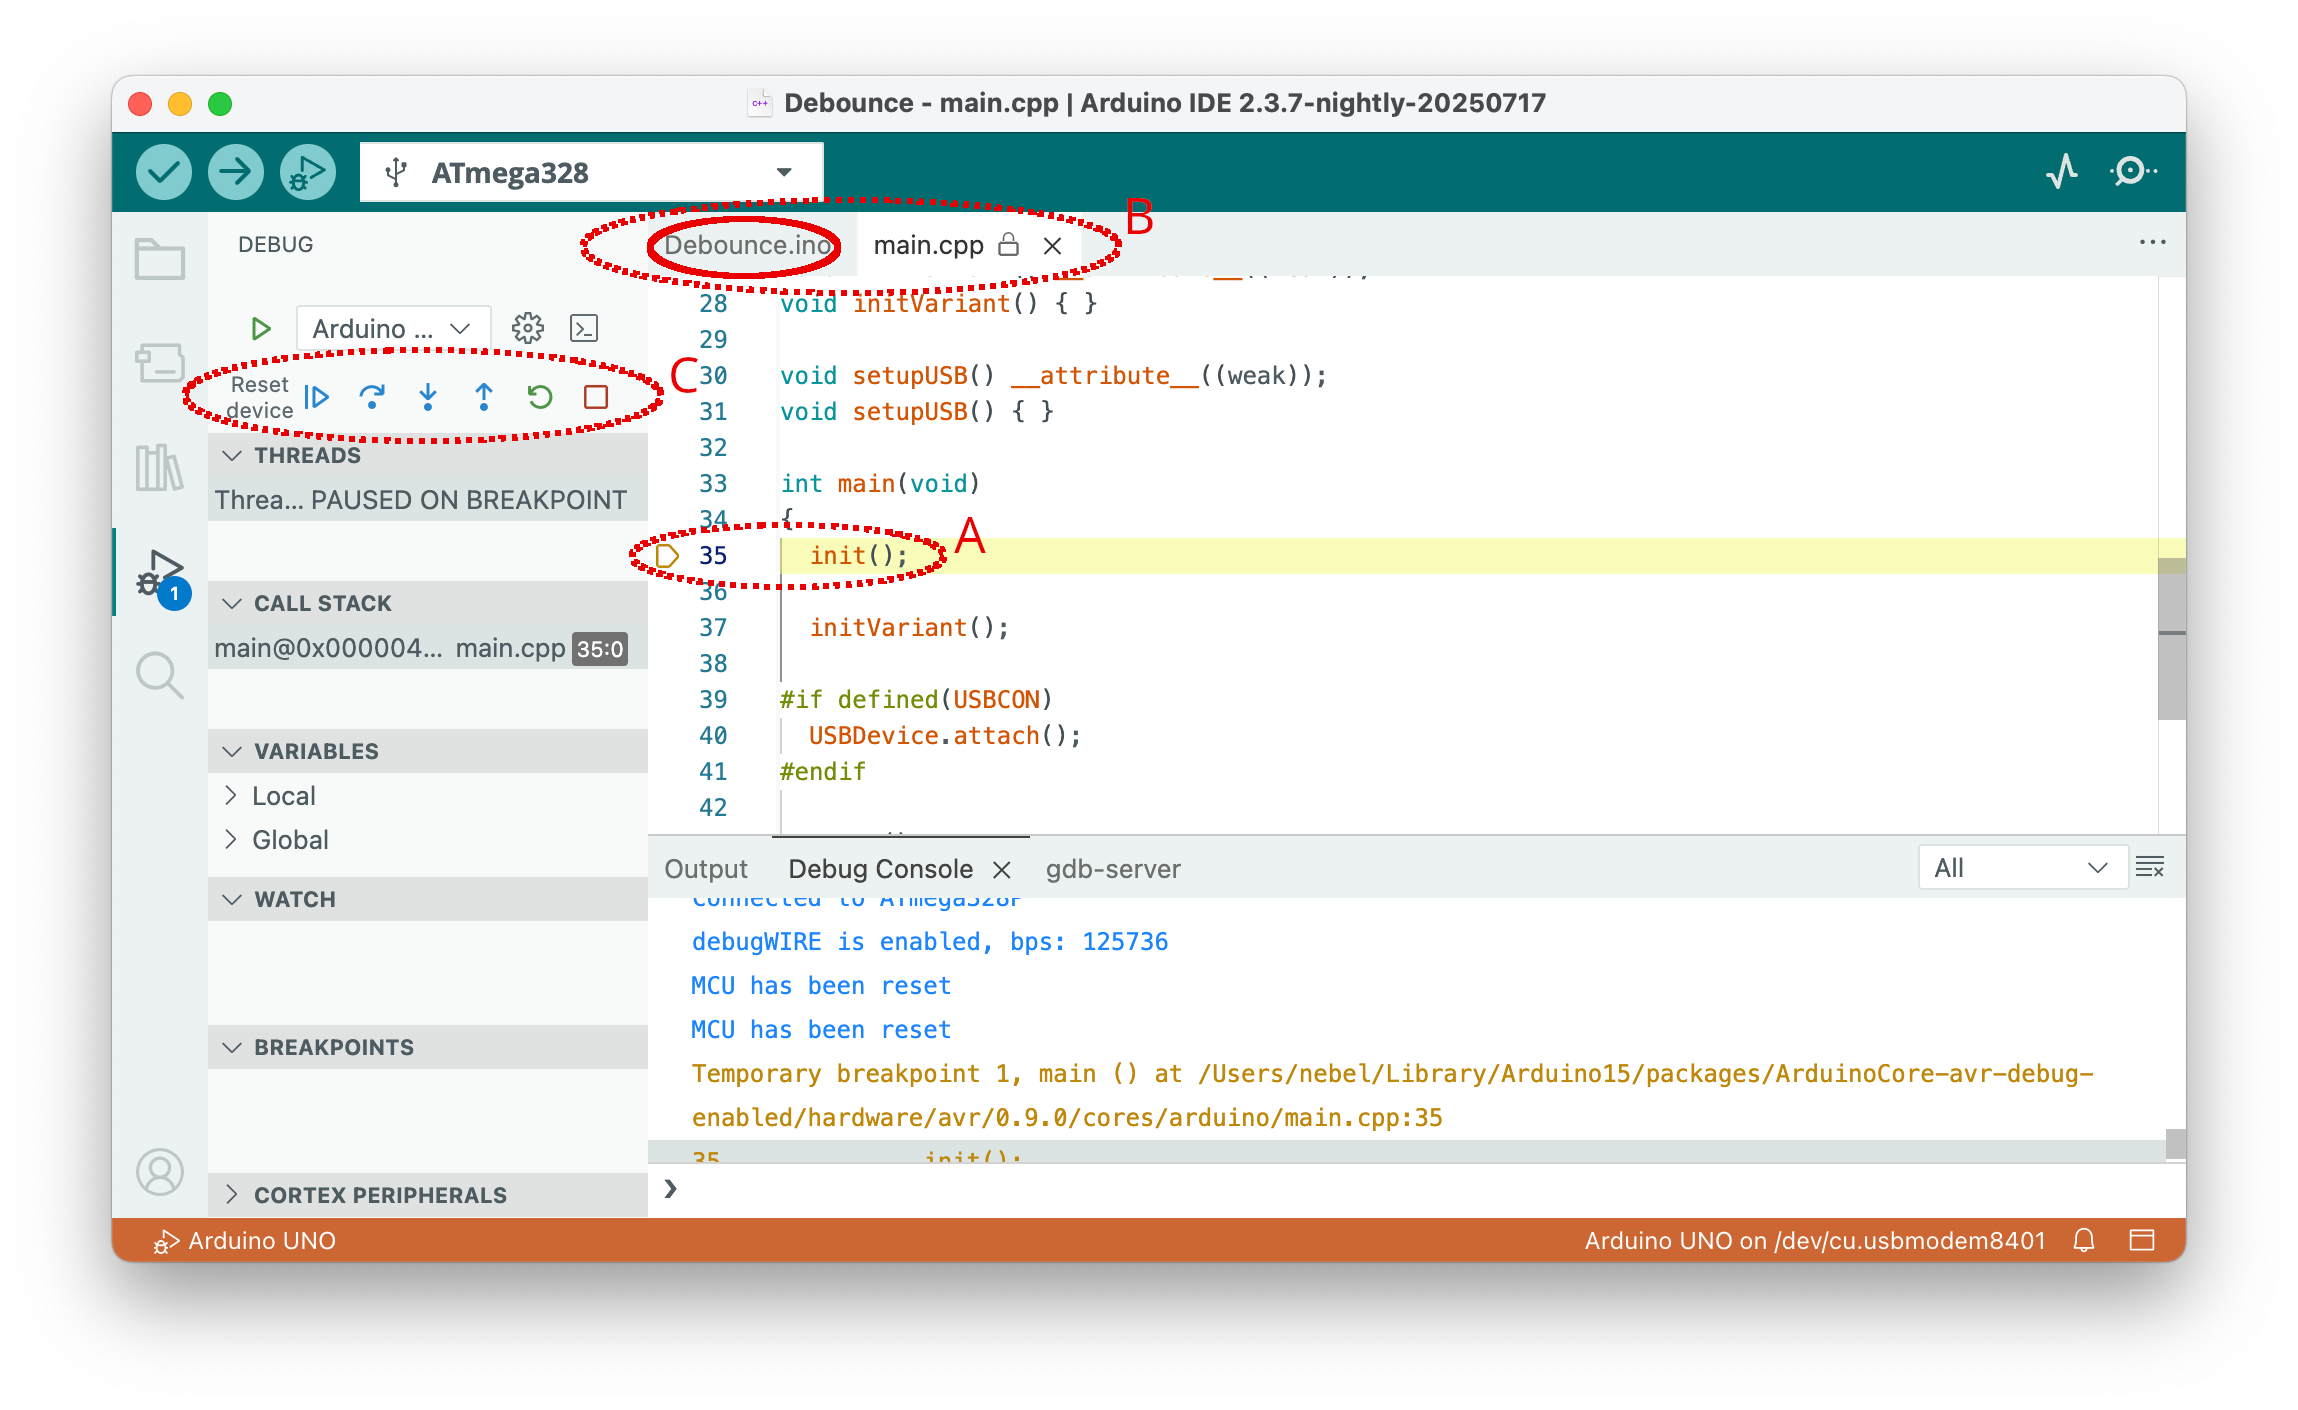
The execution will always stop in the first line of the main function in main.cpp, which is an Arduino internal function. The line where execution has been stopped is marked yellow (perhaps with an additional yellow triangle) (A). Since this line is in a file different from the main sketch, it is loaded into the editor, and the loaded files are all shown in the top bar of the editor (B). The central debugging control is located in the debugging pane at the top (C). The buttons have the following meanings, from left to right:
- Resetting the device
- Continue execution or pause
- Step over: execute one source line
- Step into: execute stepping into the function, if in this line one is called
- Step out: finish the current function and stop after the line where it was called
- Restart: Same as Reset
- Stop: Terminate debugging
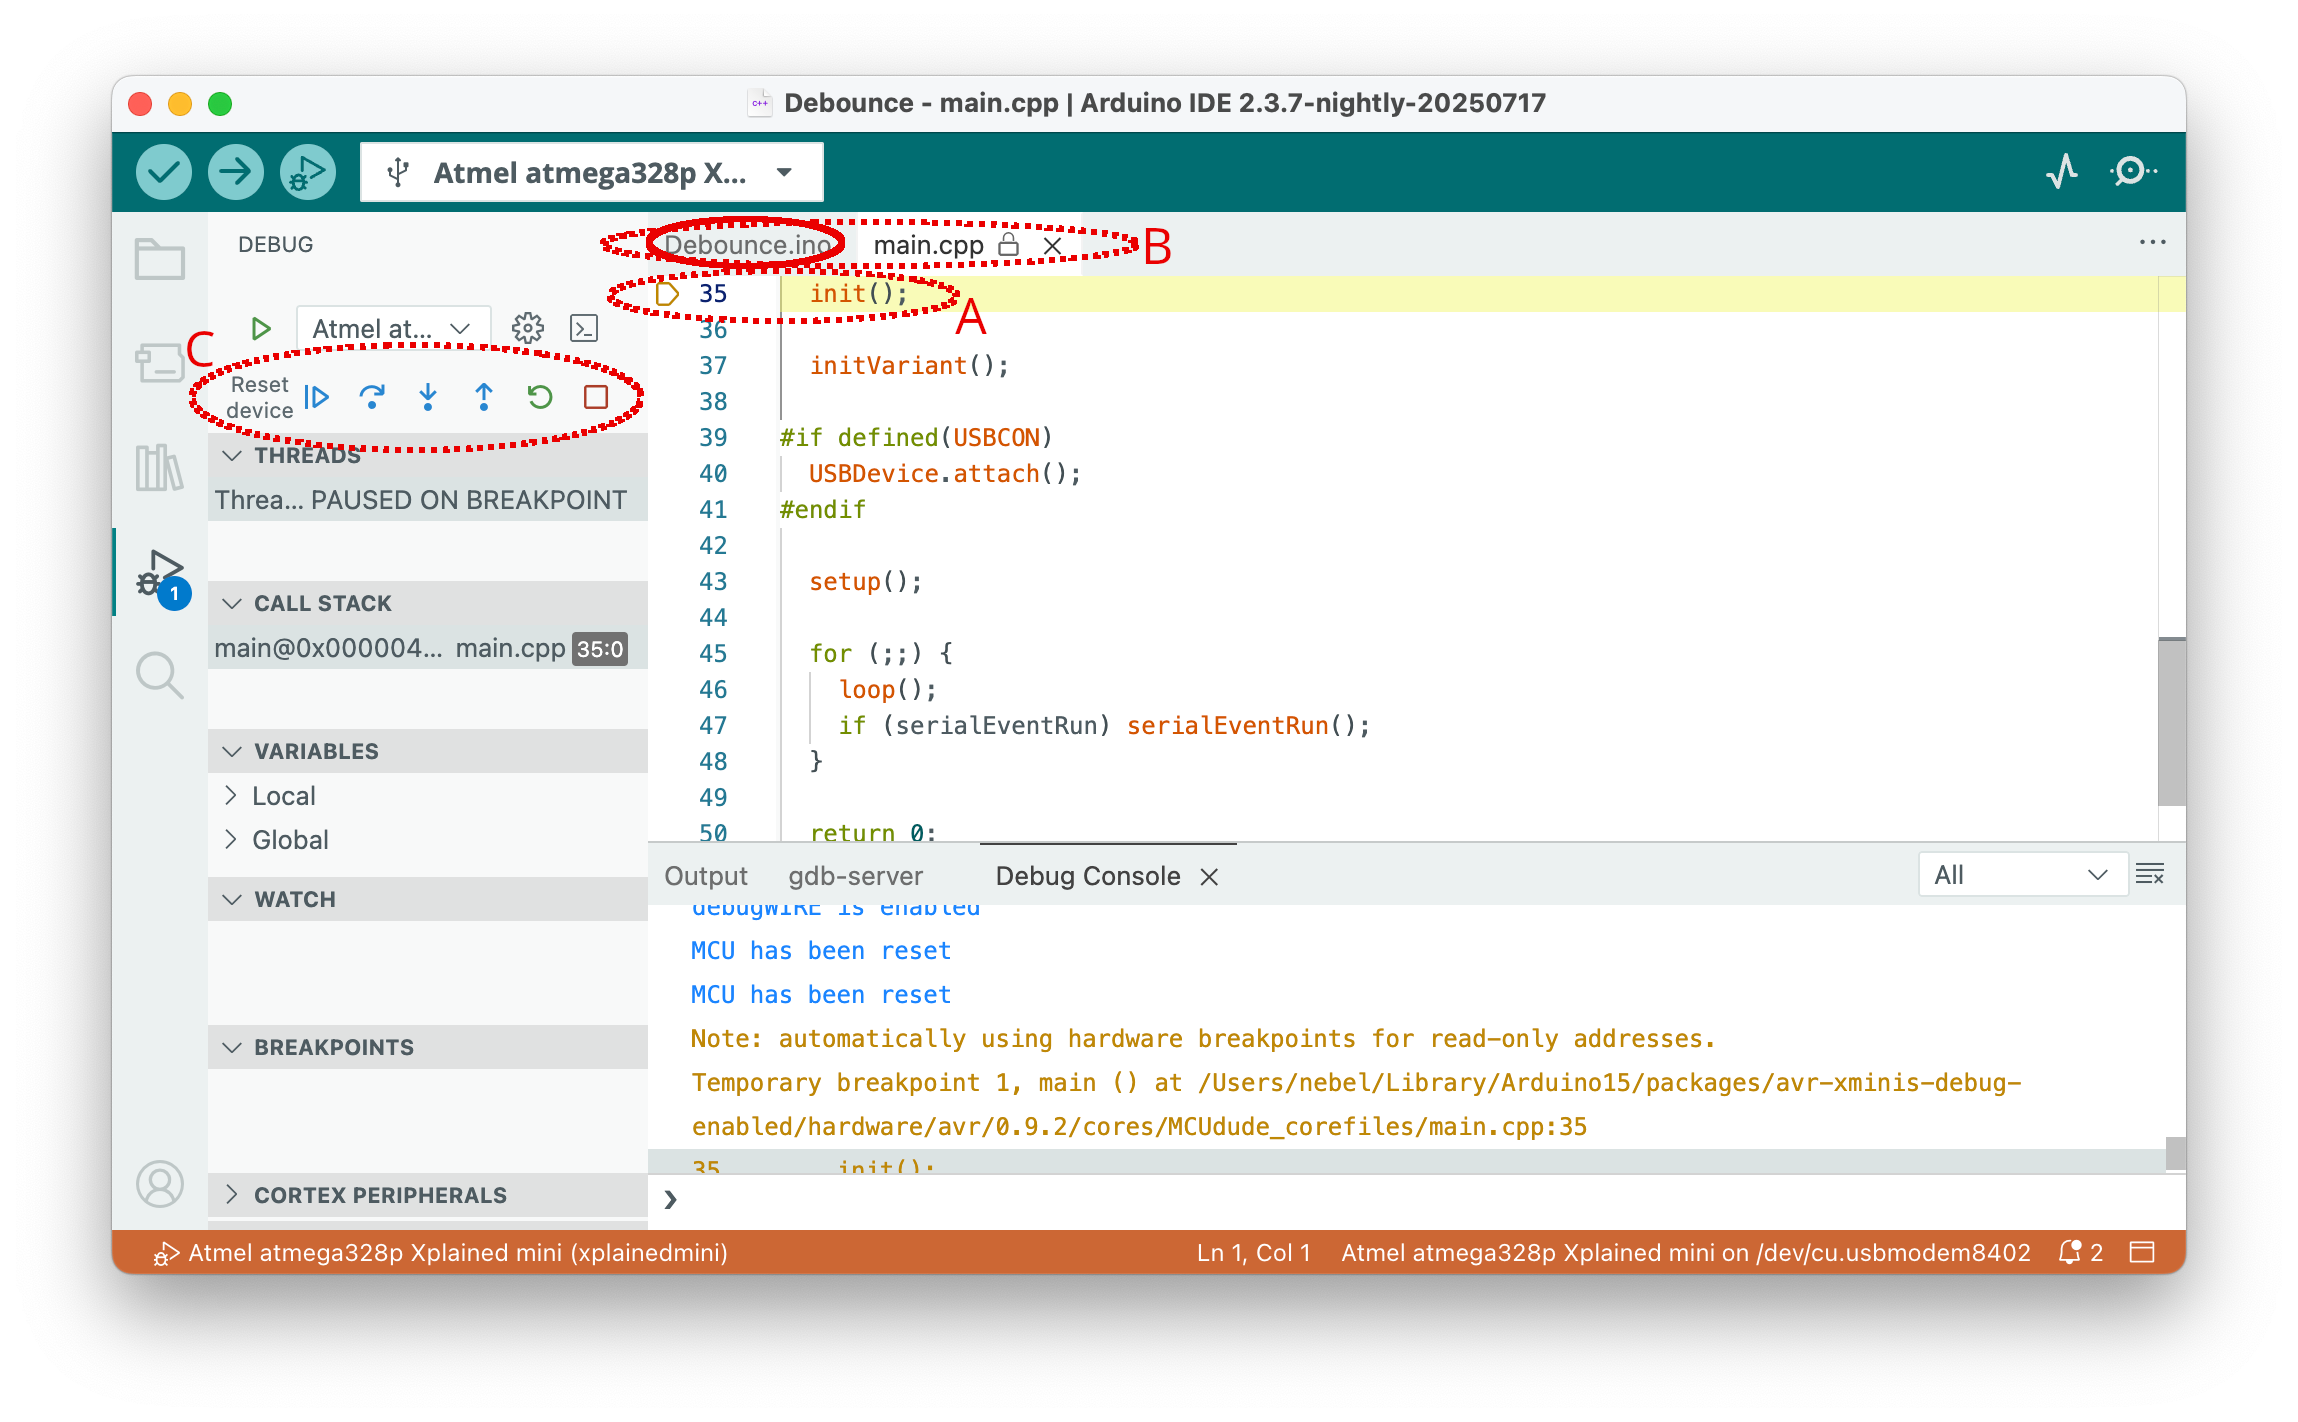
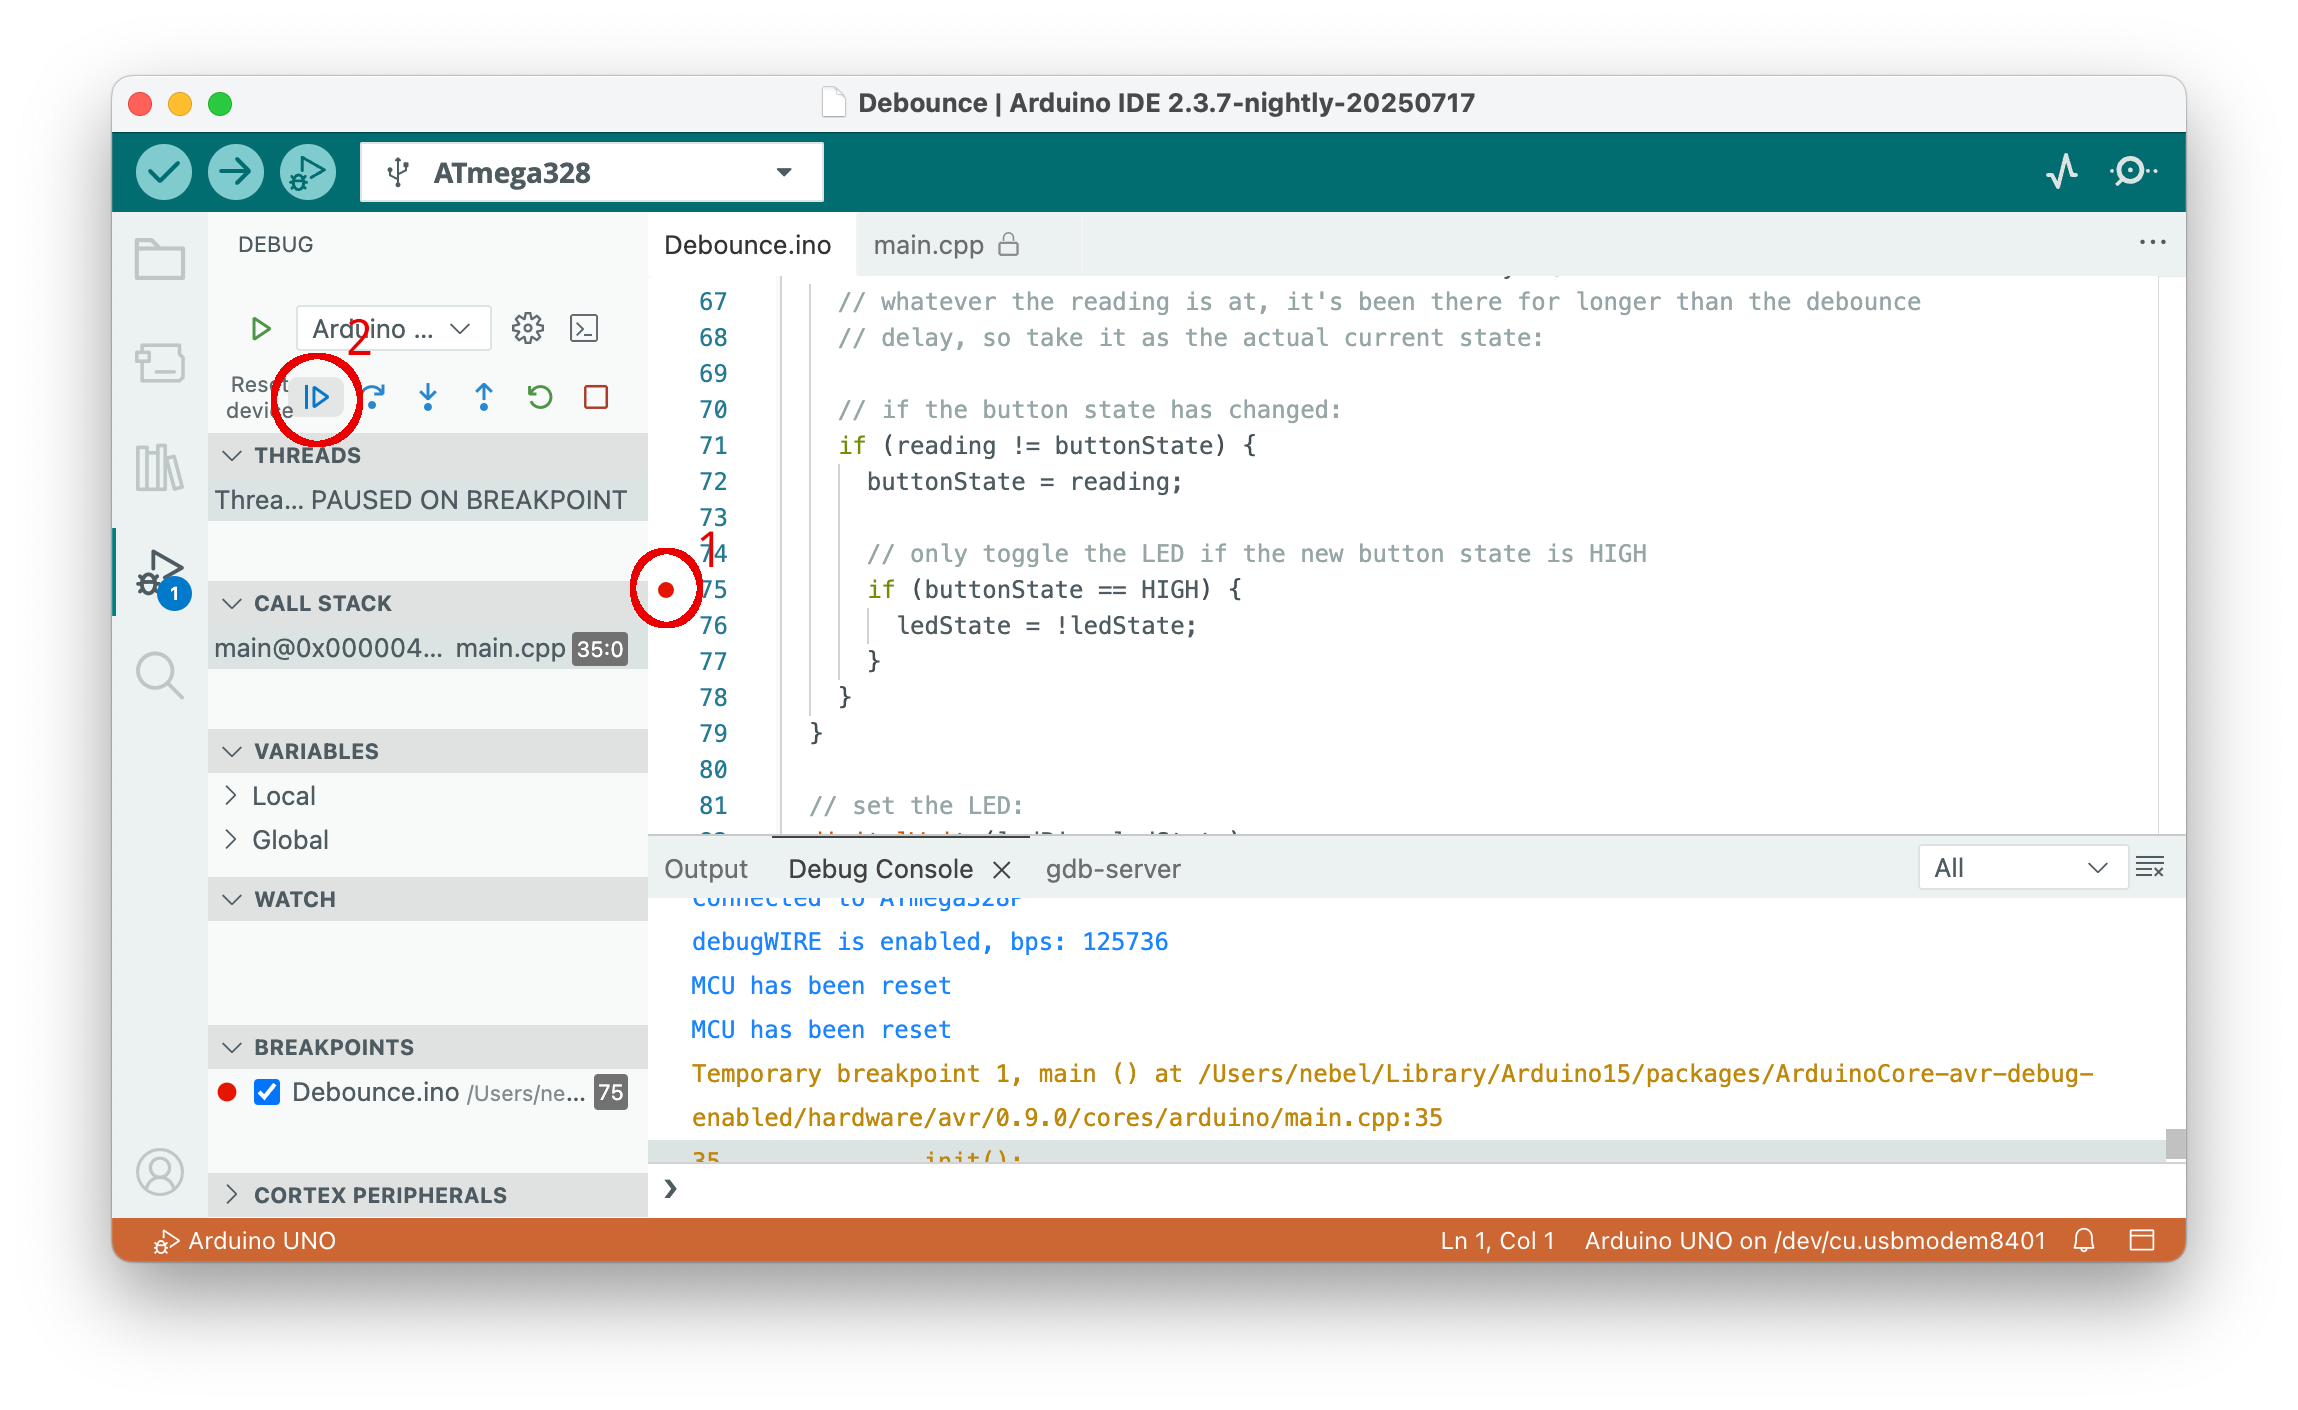
Pressing the Continue button in the situation depicted in the picture above would start execution. However, before we do this, let us set a breakpoint. For this purpose, we first select the original sketch file Debounce.ino at the top row of the editor pane.
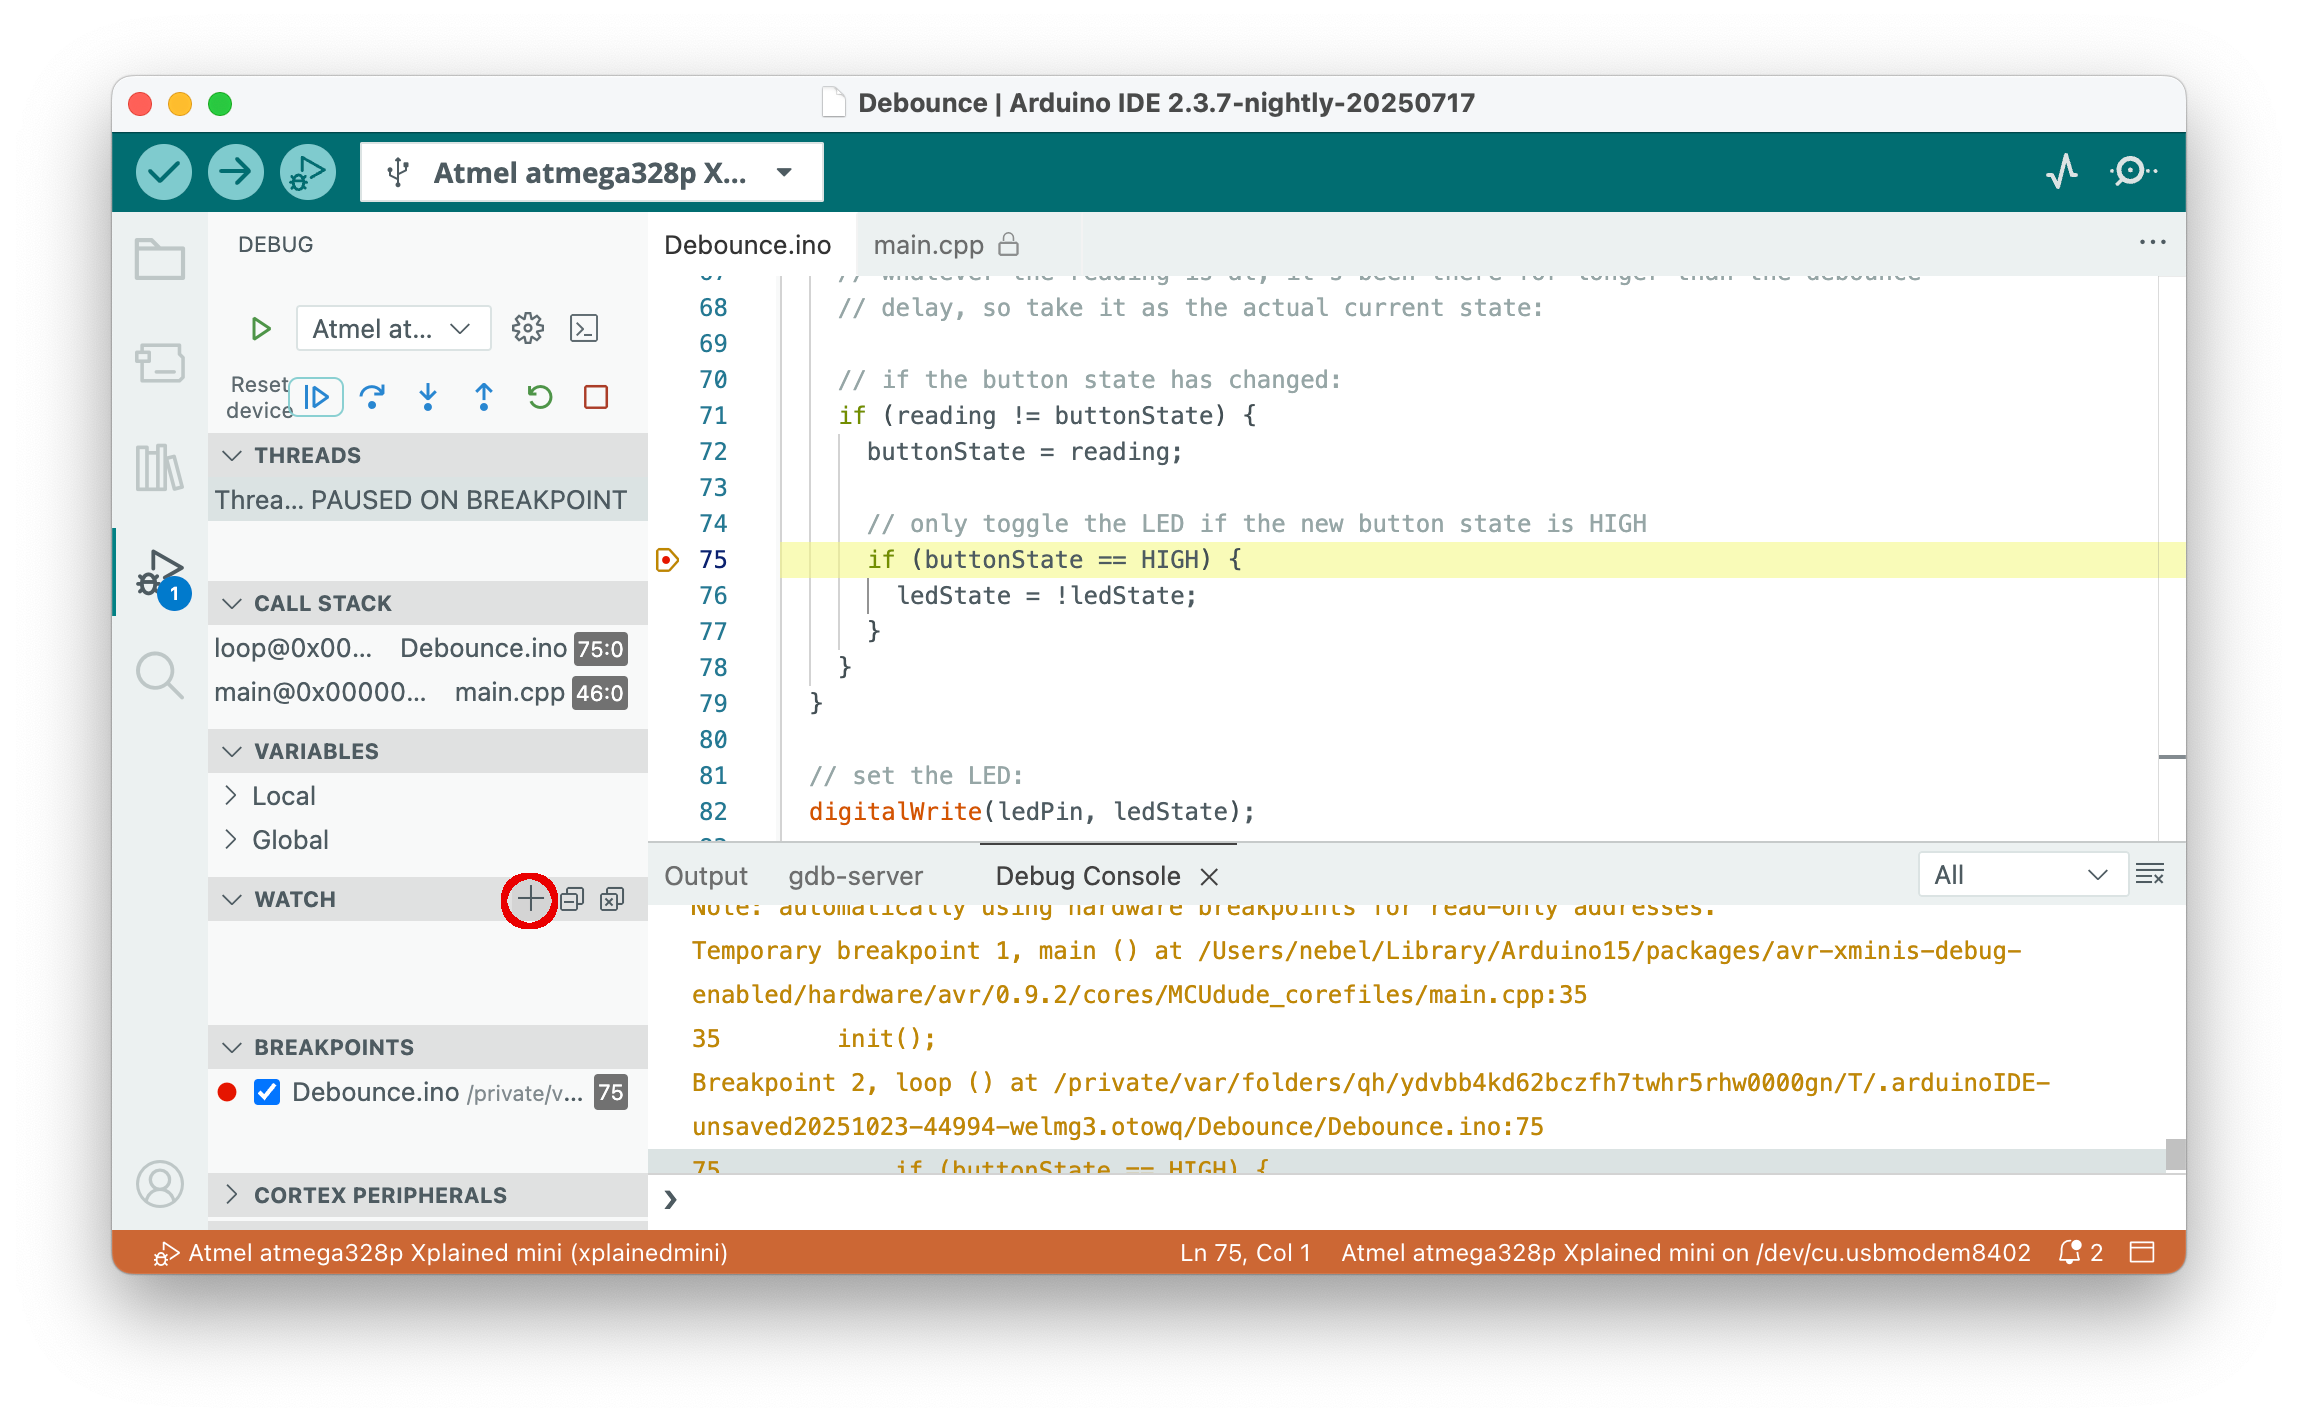
This will bring up the sketch file. Scroll down to line 75 and set a breakpoint by clicking to the left of the line number (1). A red dot will mark the breakpoint. Now press the Continue button (2).
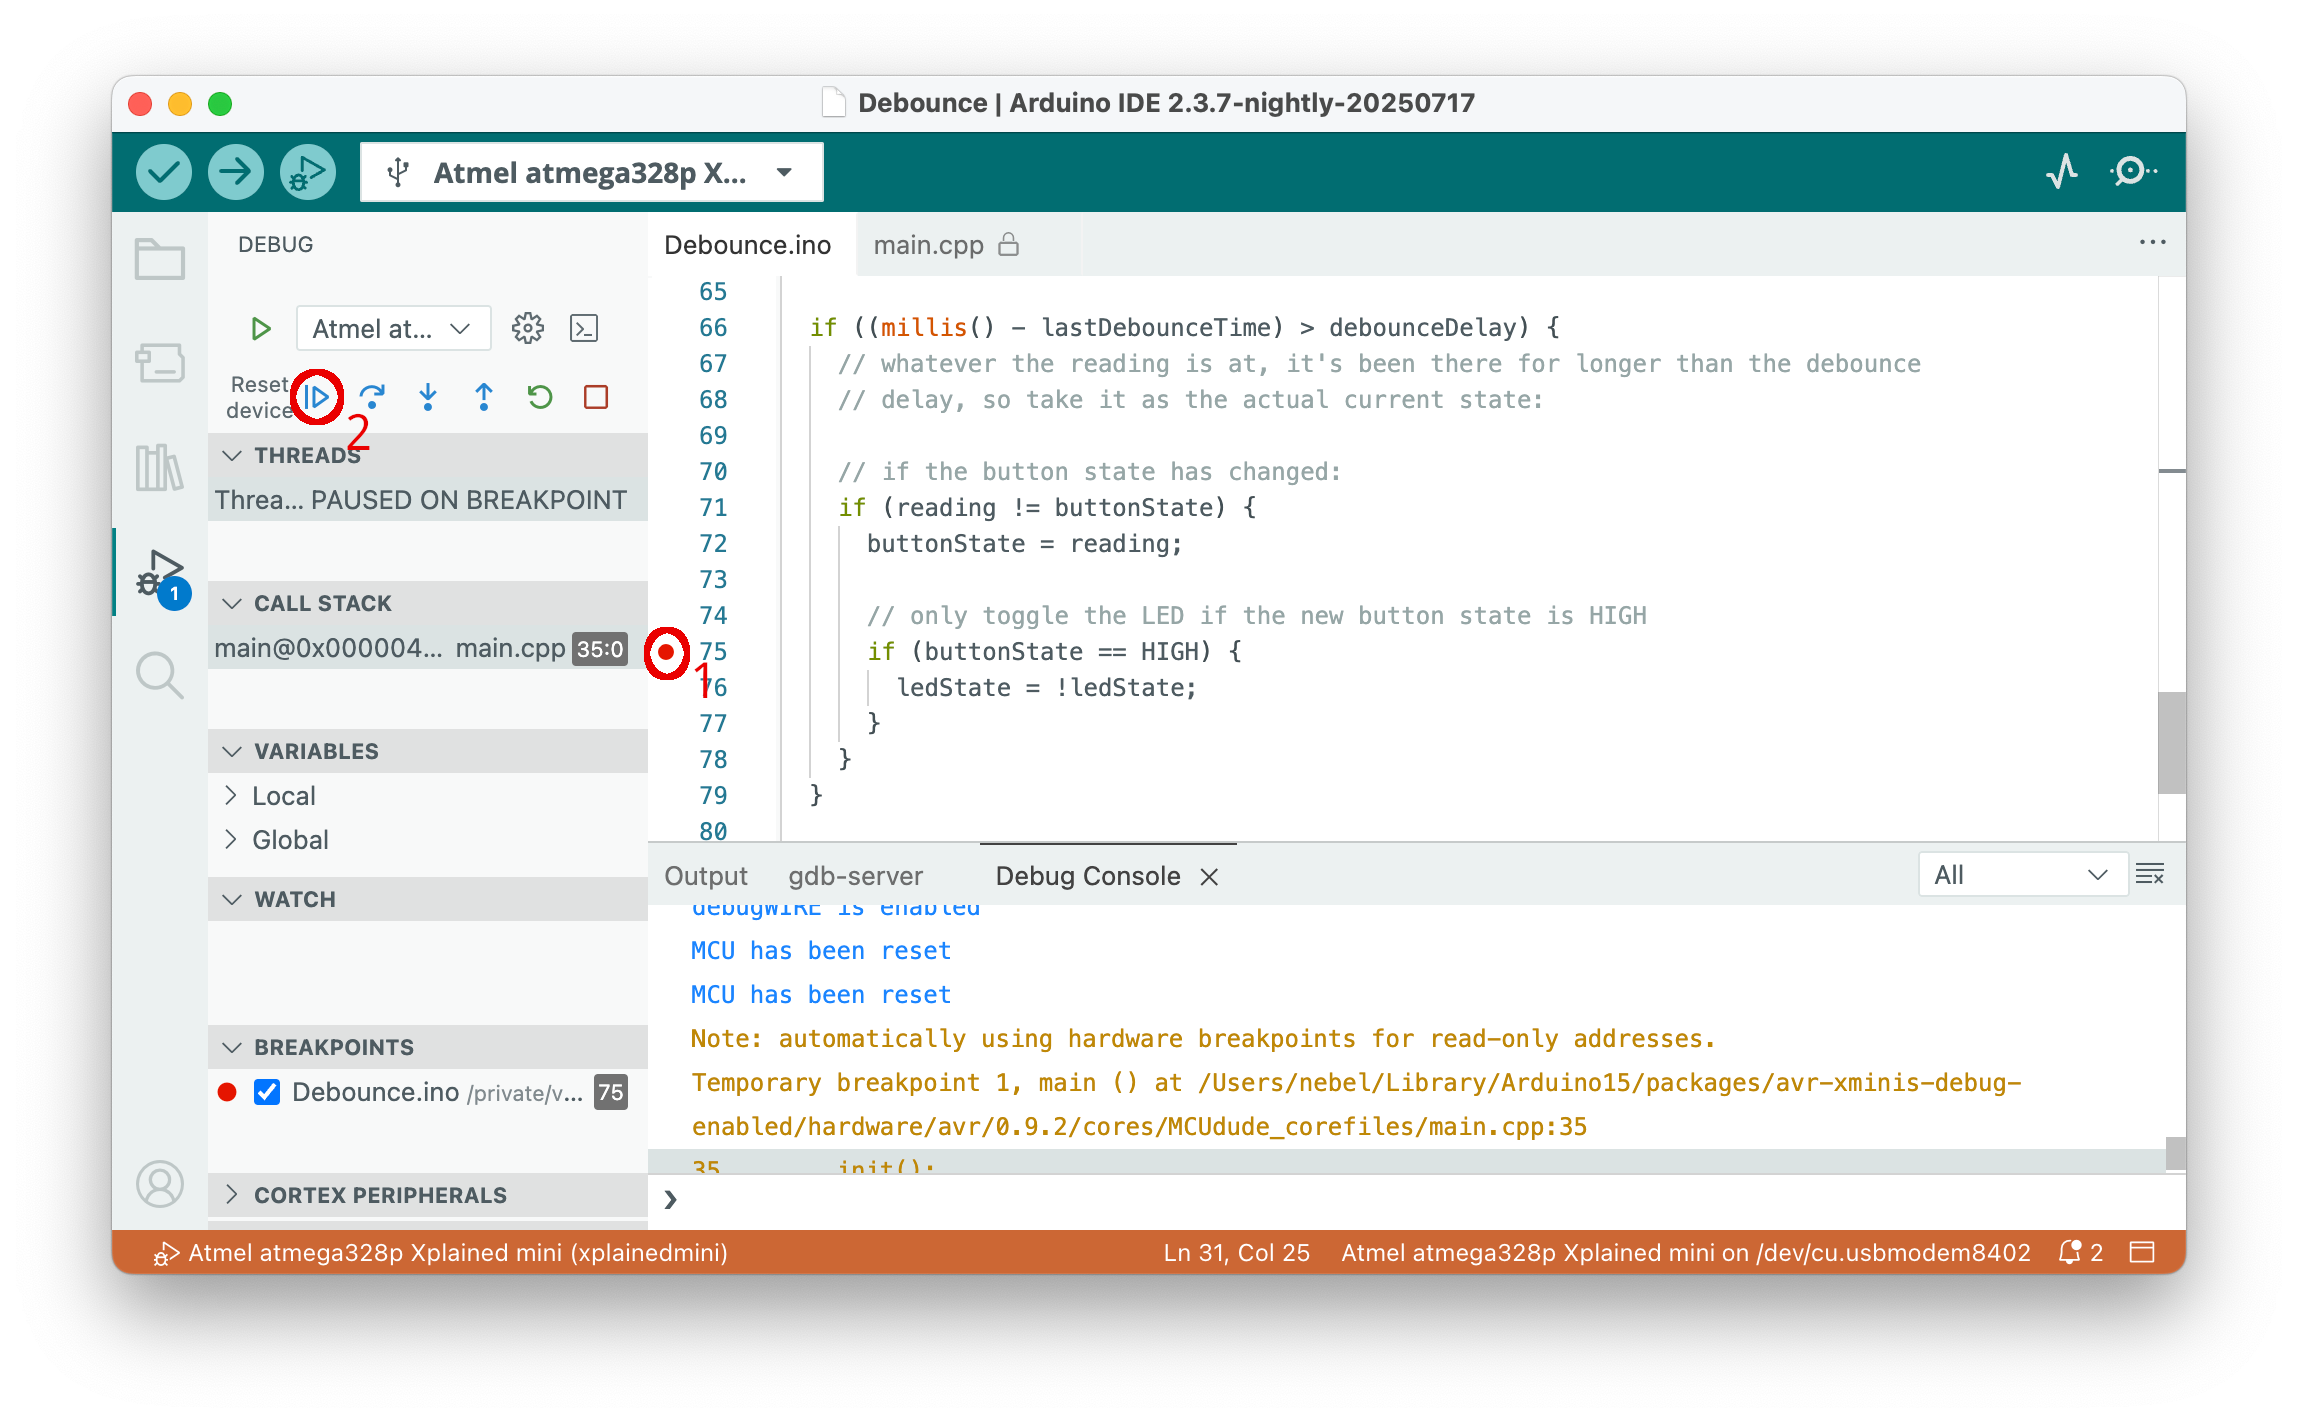
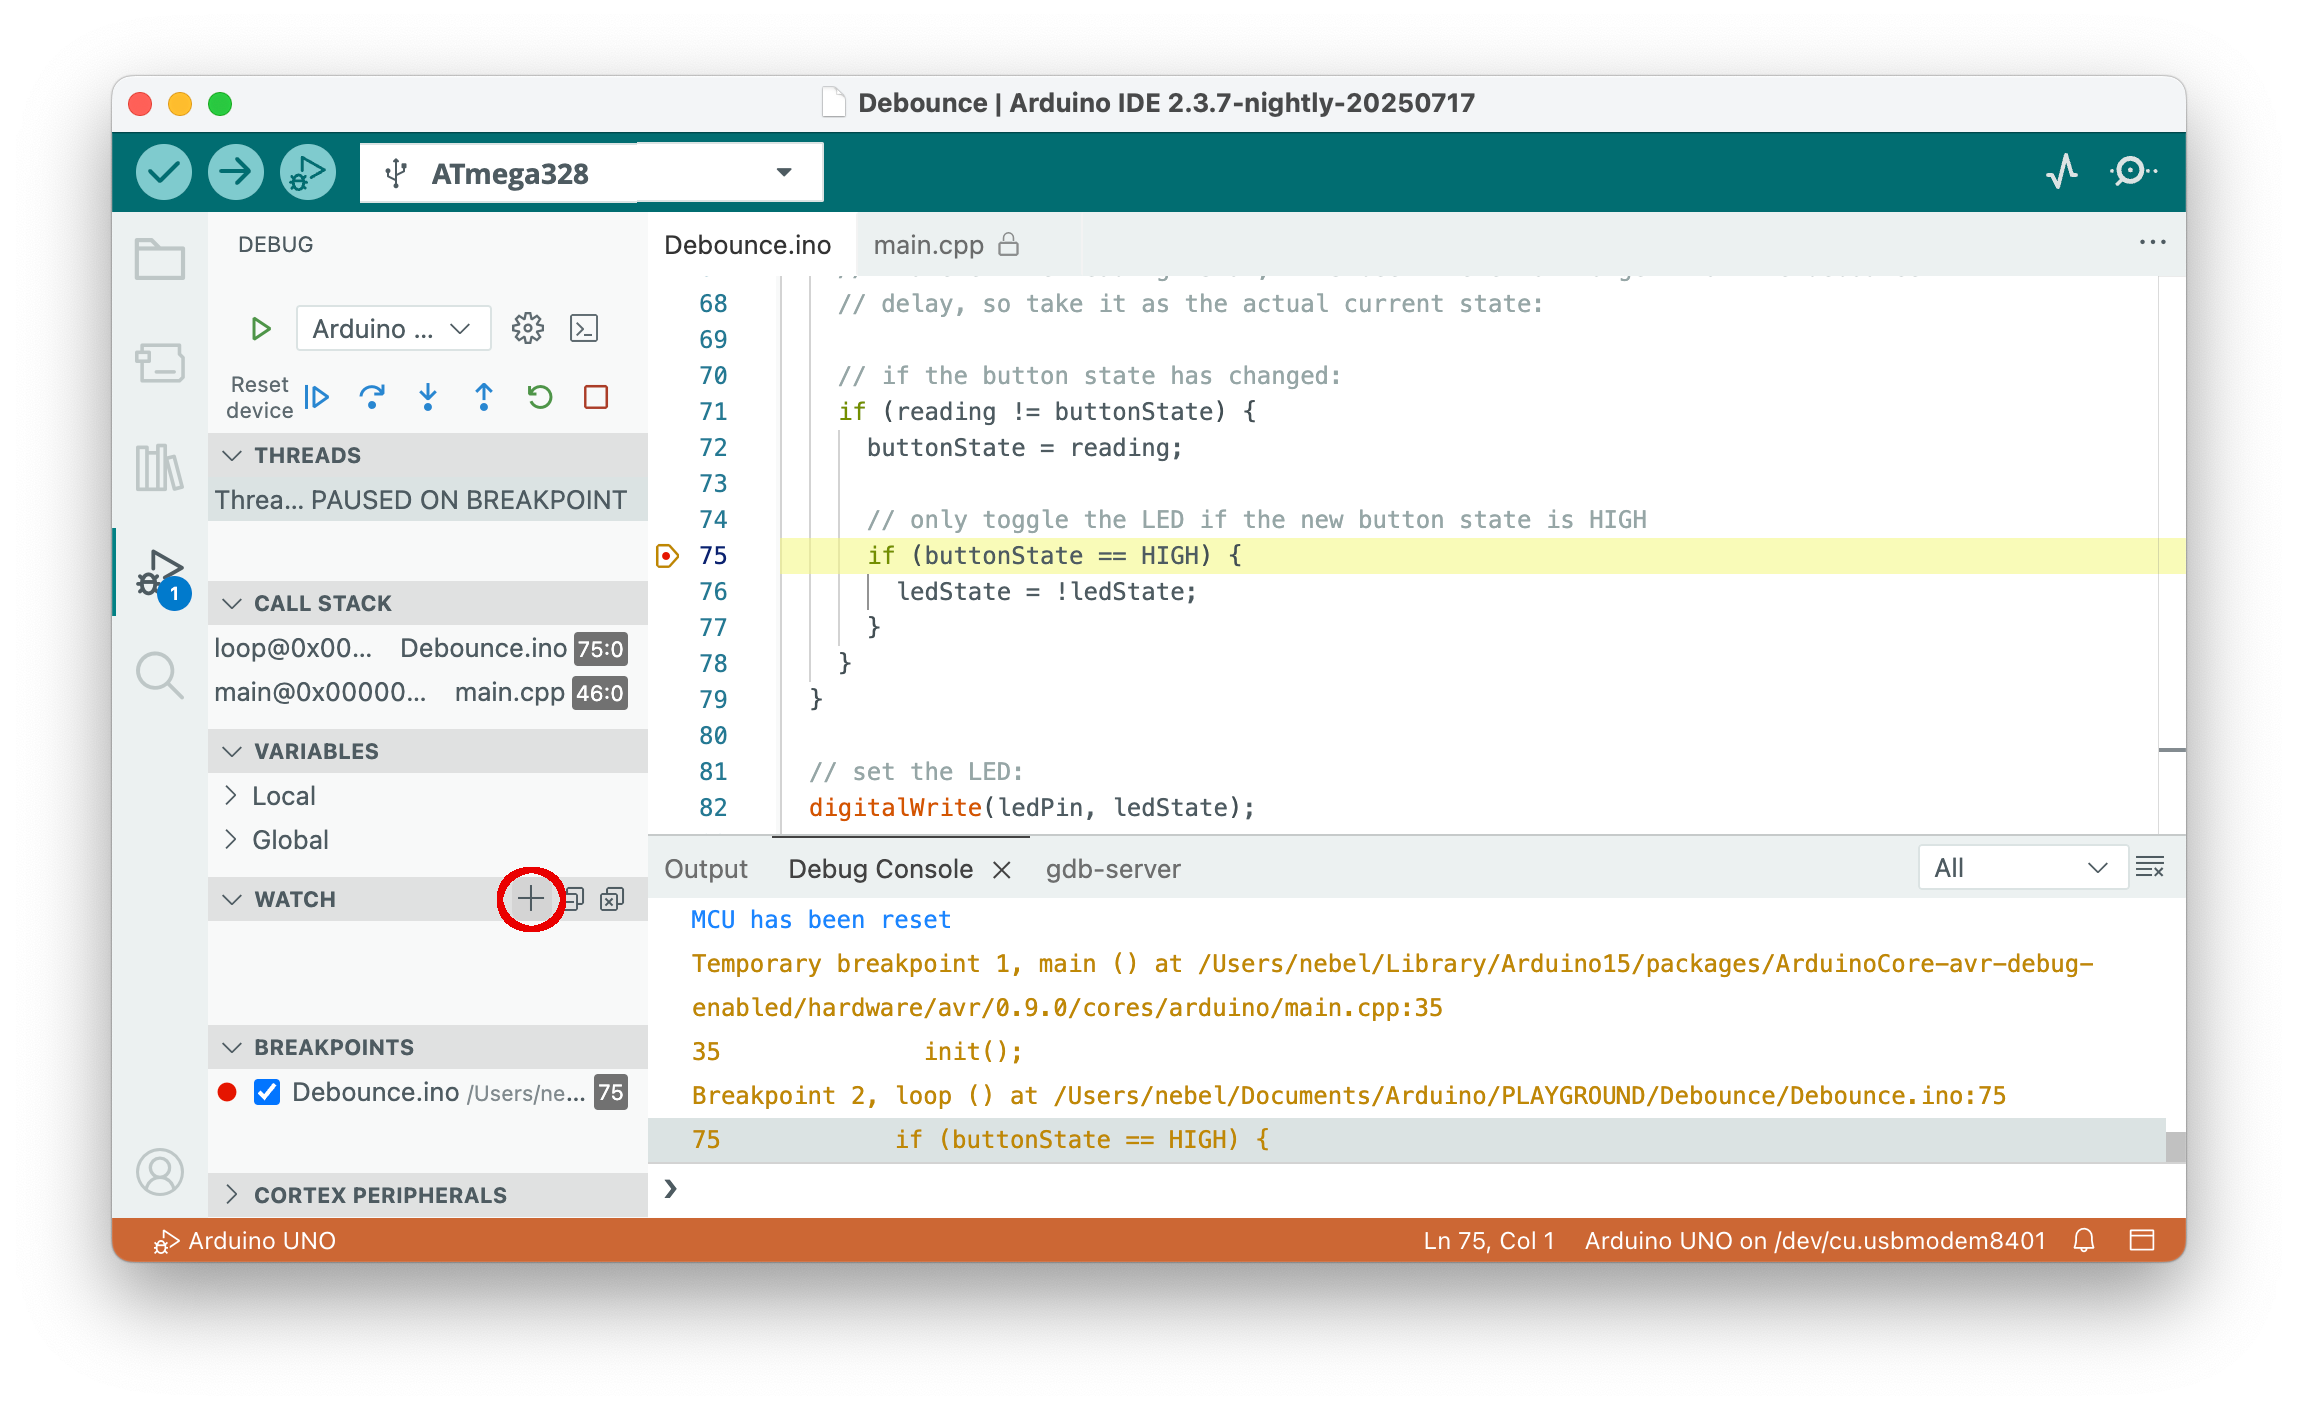
Sketch execution will be immediately stopped in line 75. Now we want to examine the values of some of the variables. If you hover with the mouse over a variable, its value will be shown. If we want to always track the value of the variable, we can use the watch window. Move with the mouse to the right part of the WATCH bar. Then a plus sign will appear. Clicking on it allows you to enter "watch" expressions.
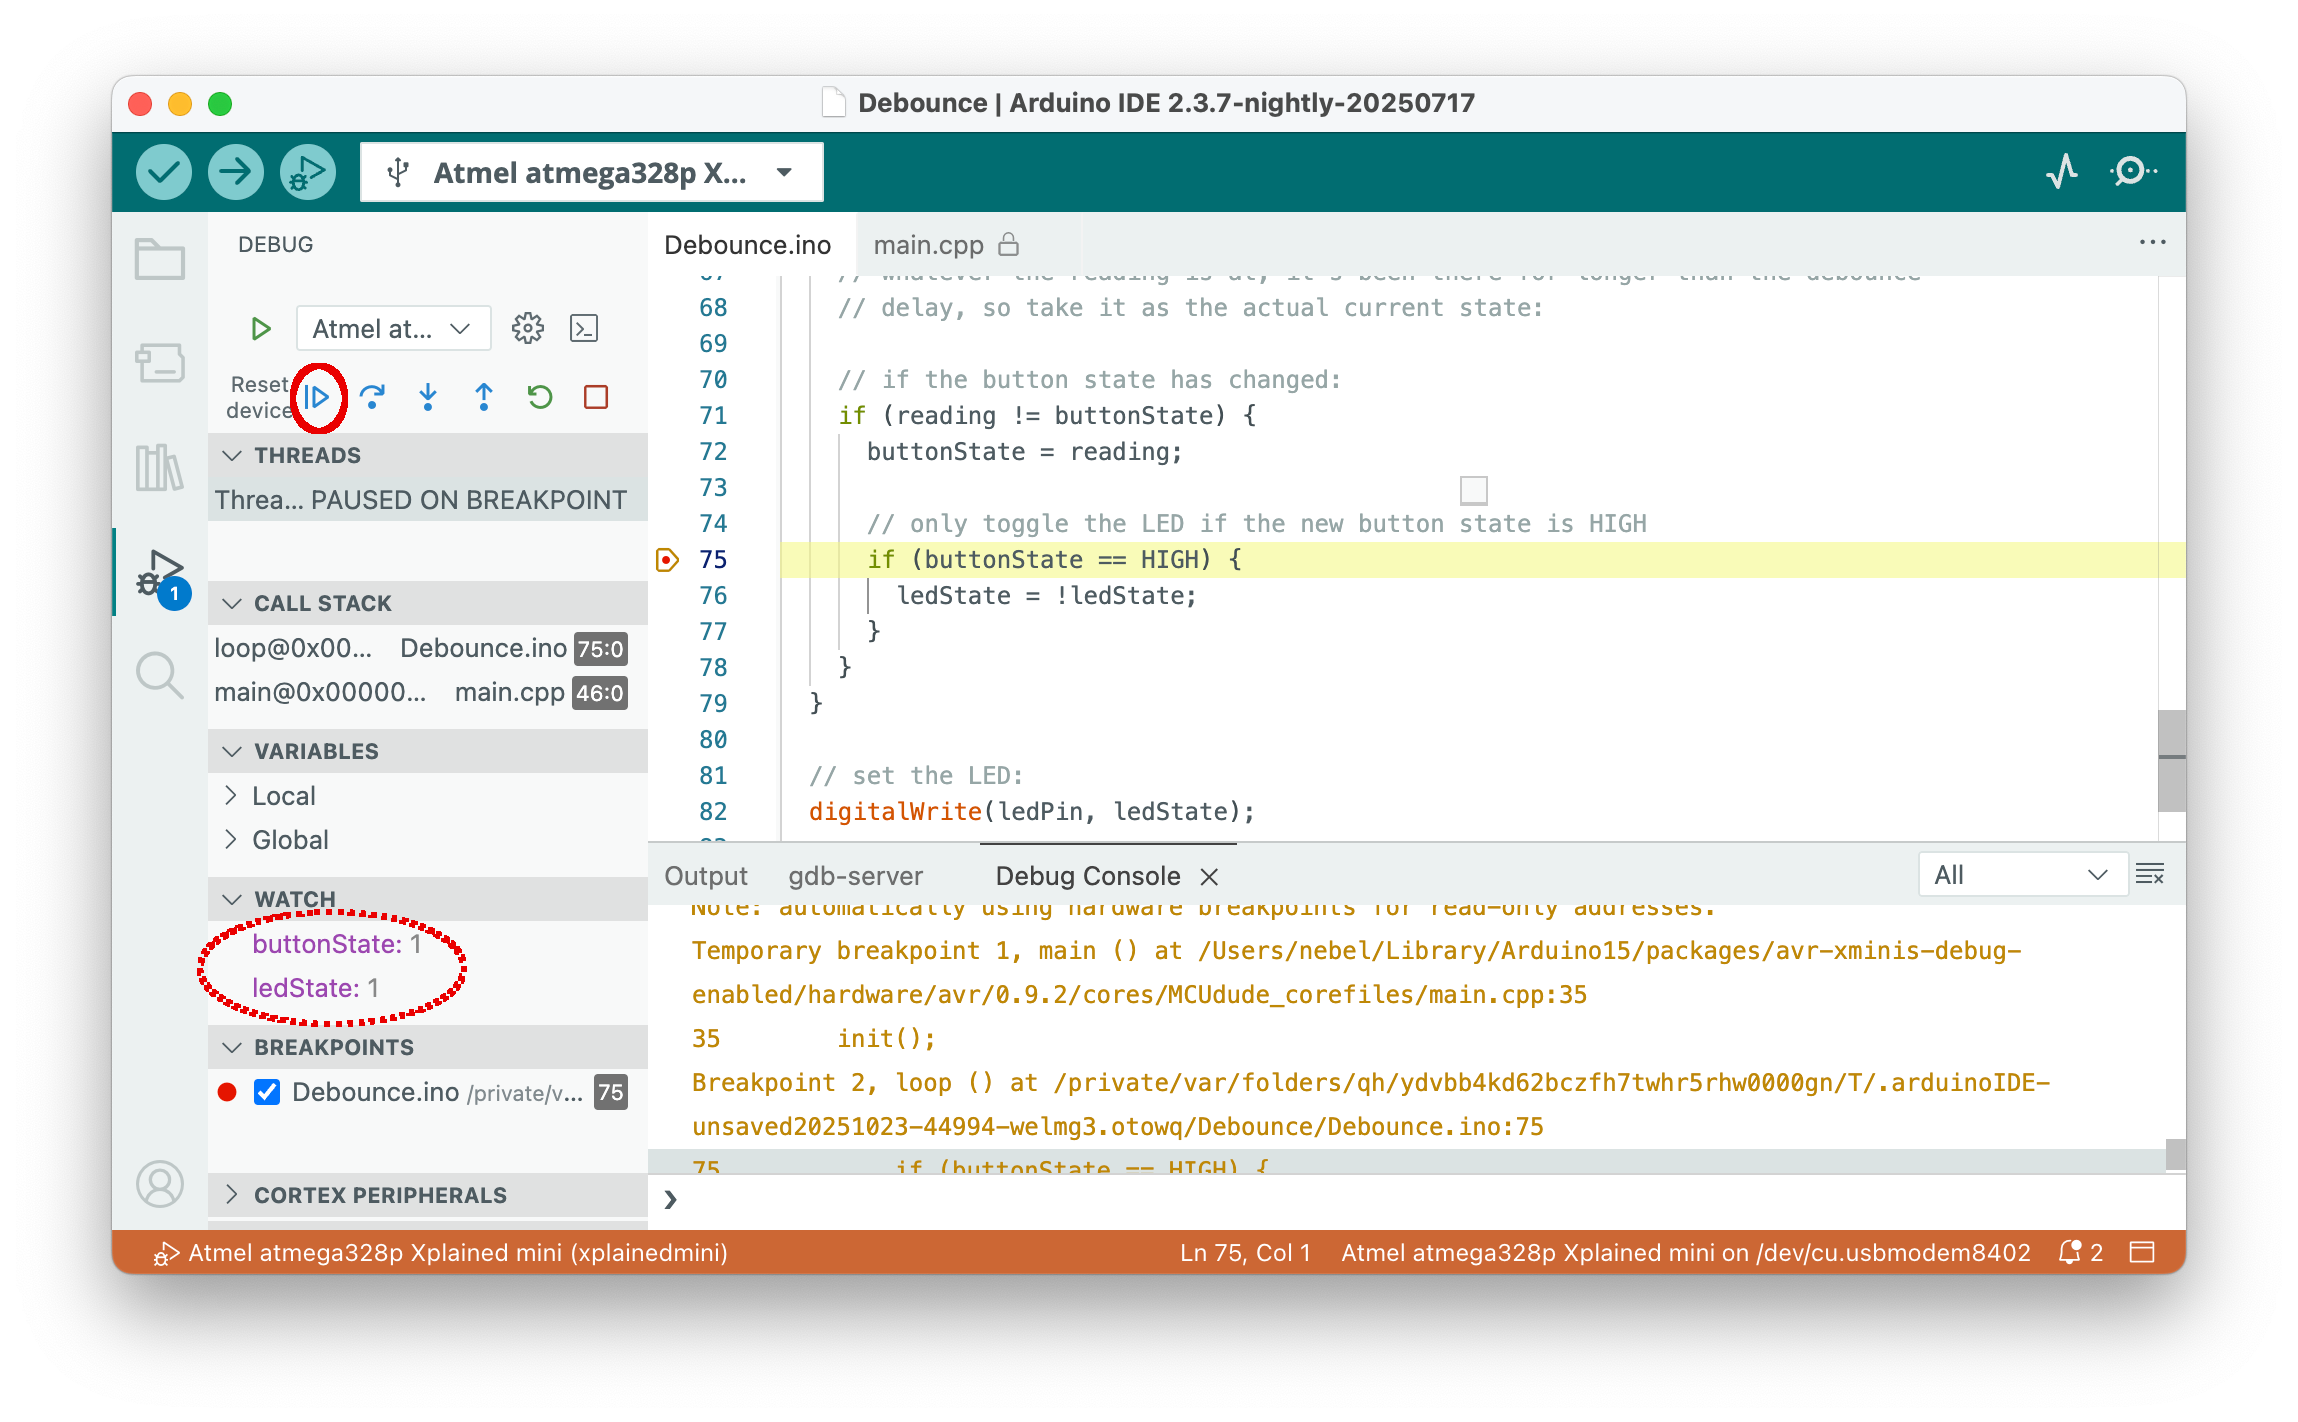
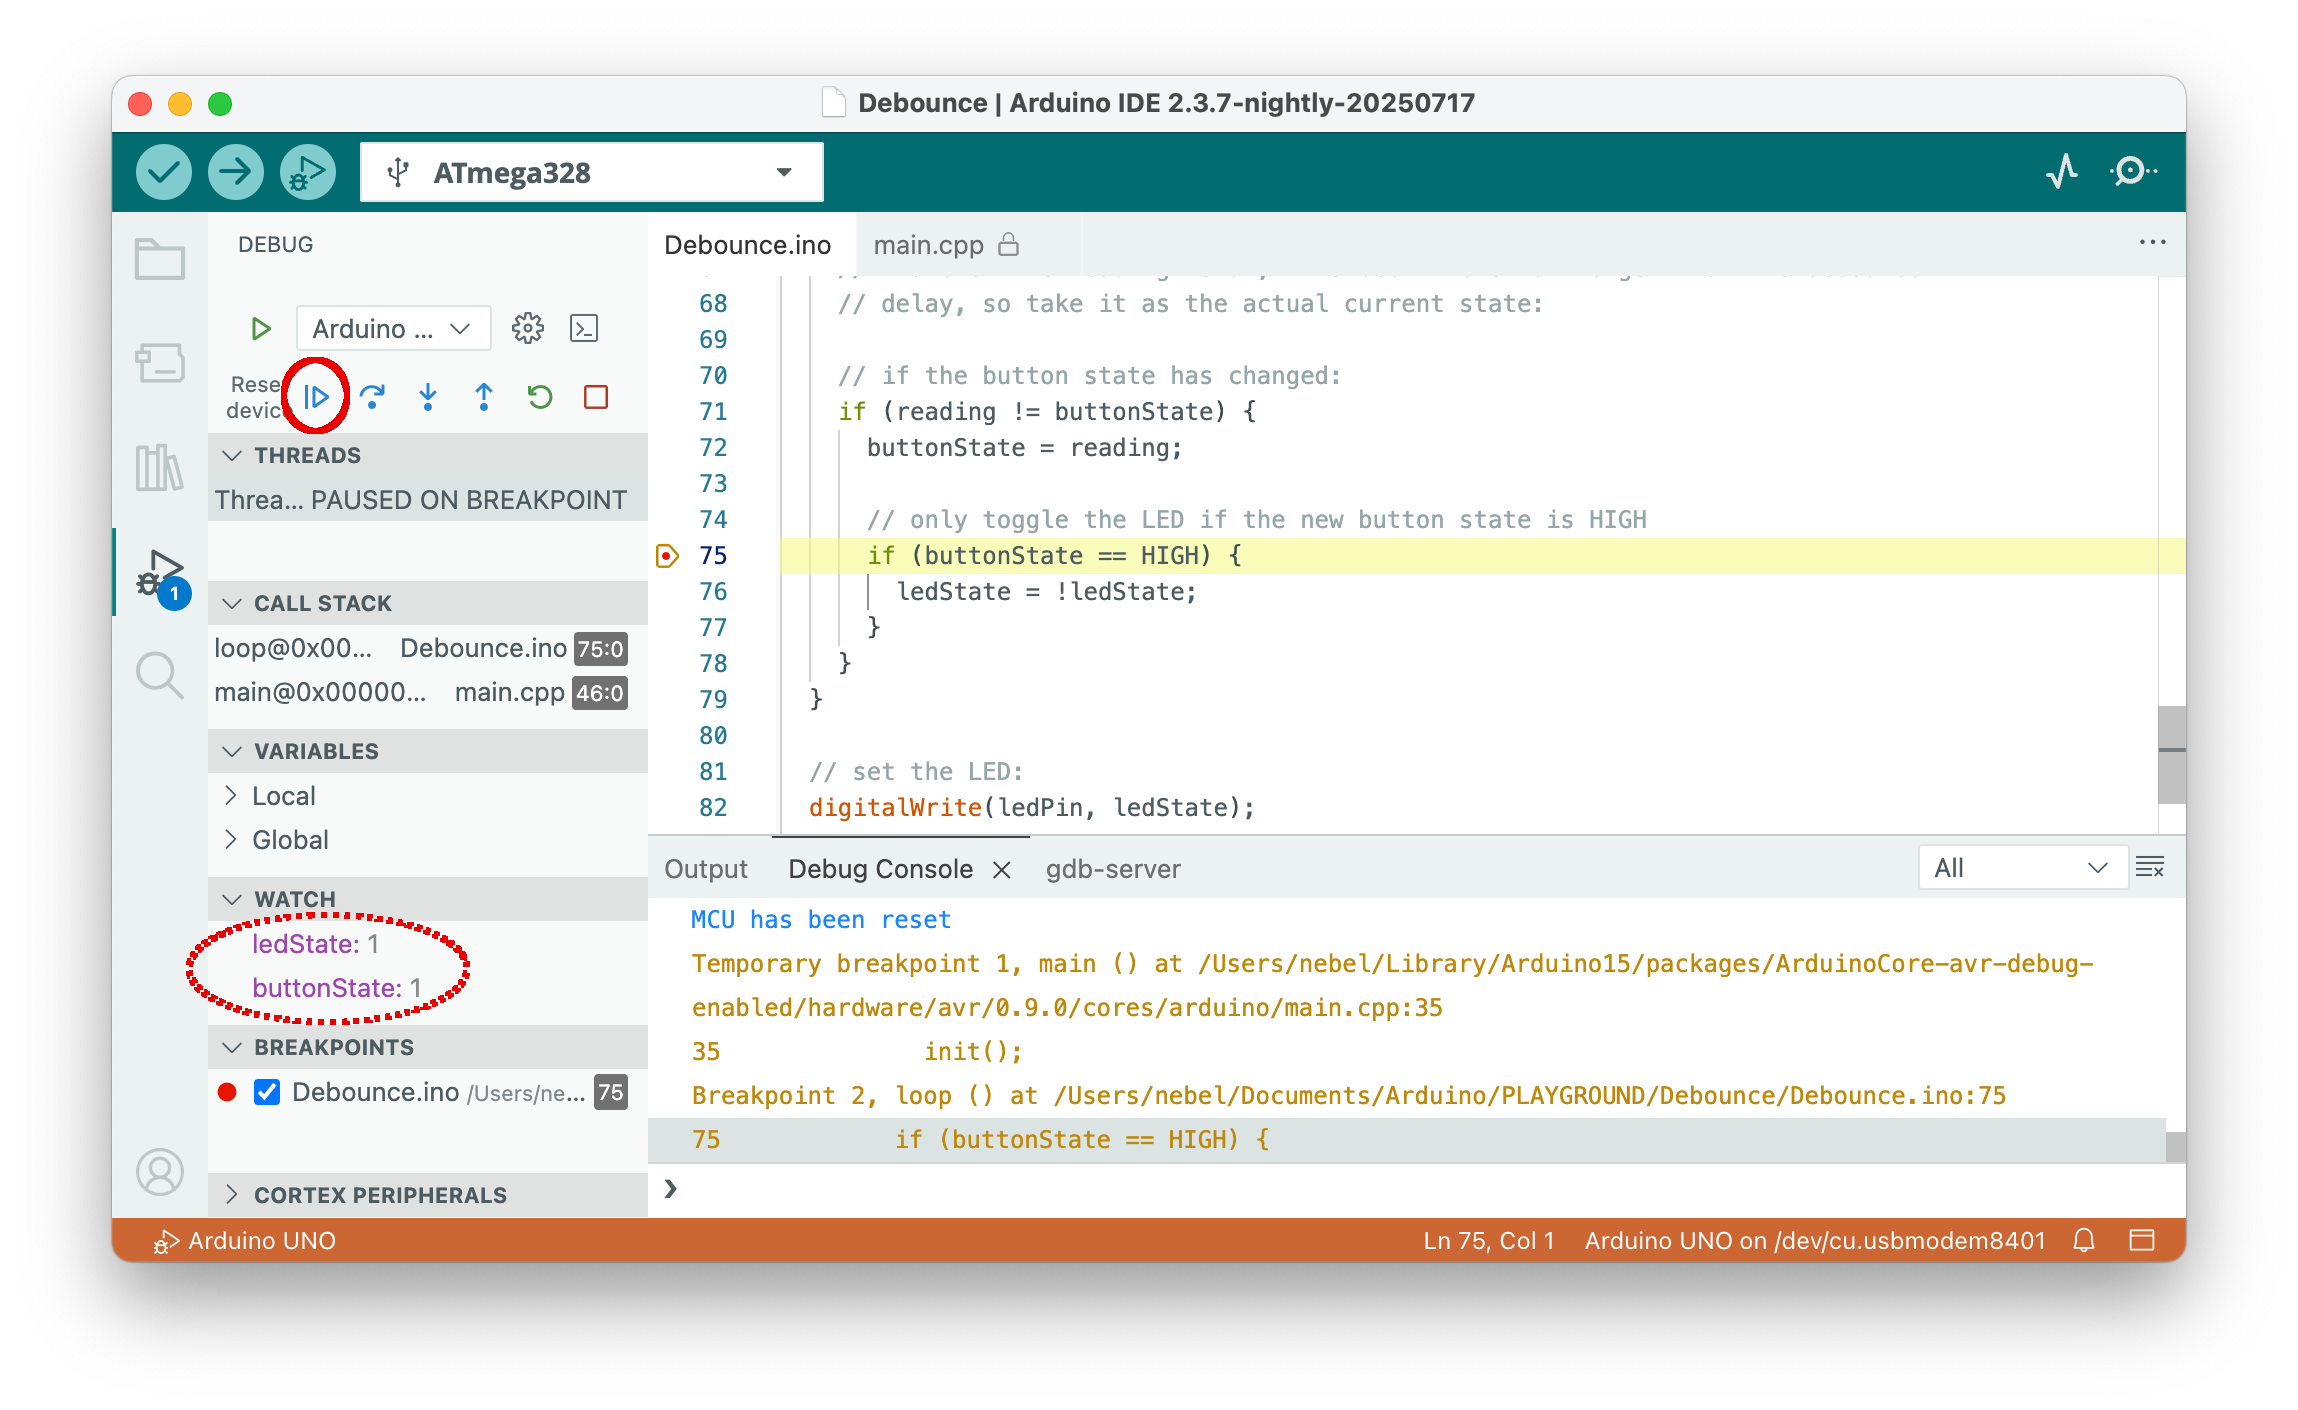
If we add buttonState and ledState to the WATCH pane, we see that they are both currently 1. If we now click the Continue button, ledState variable will be toggled (i.e., the LED will go dark) and the sketch will wait for a change of the button state.
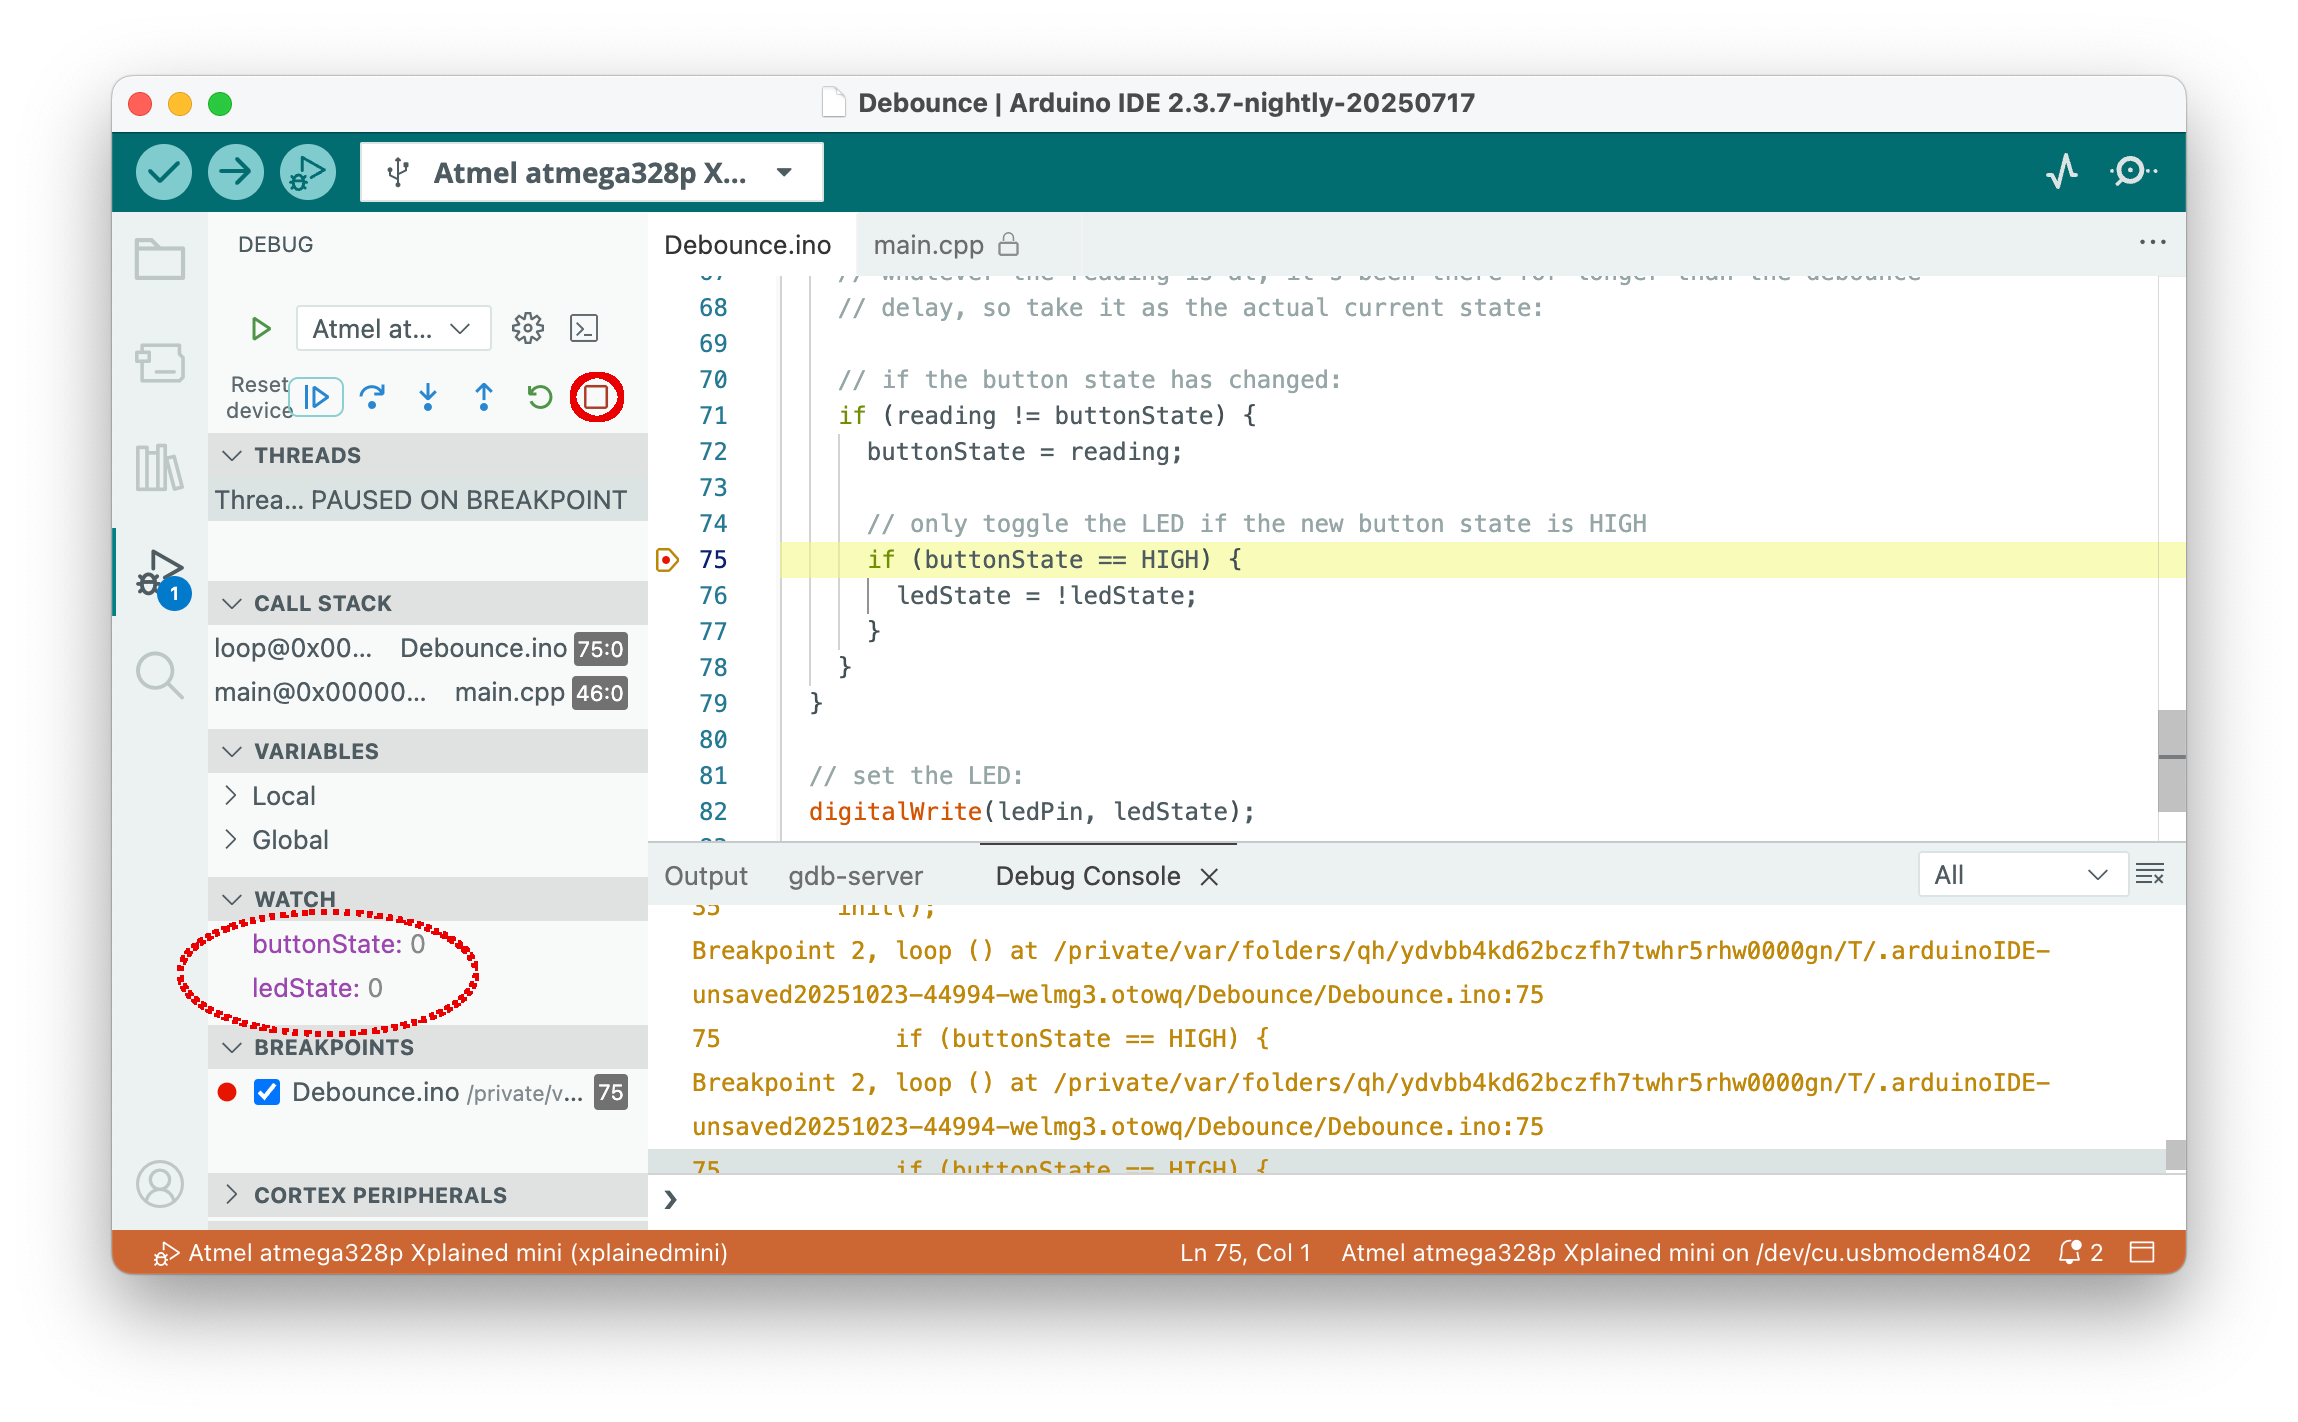
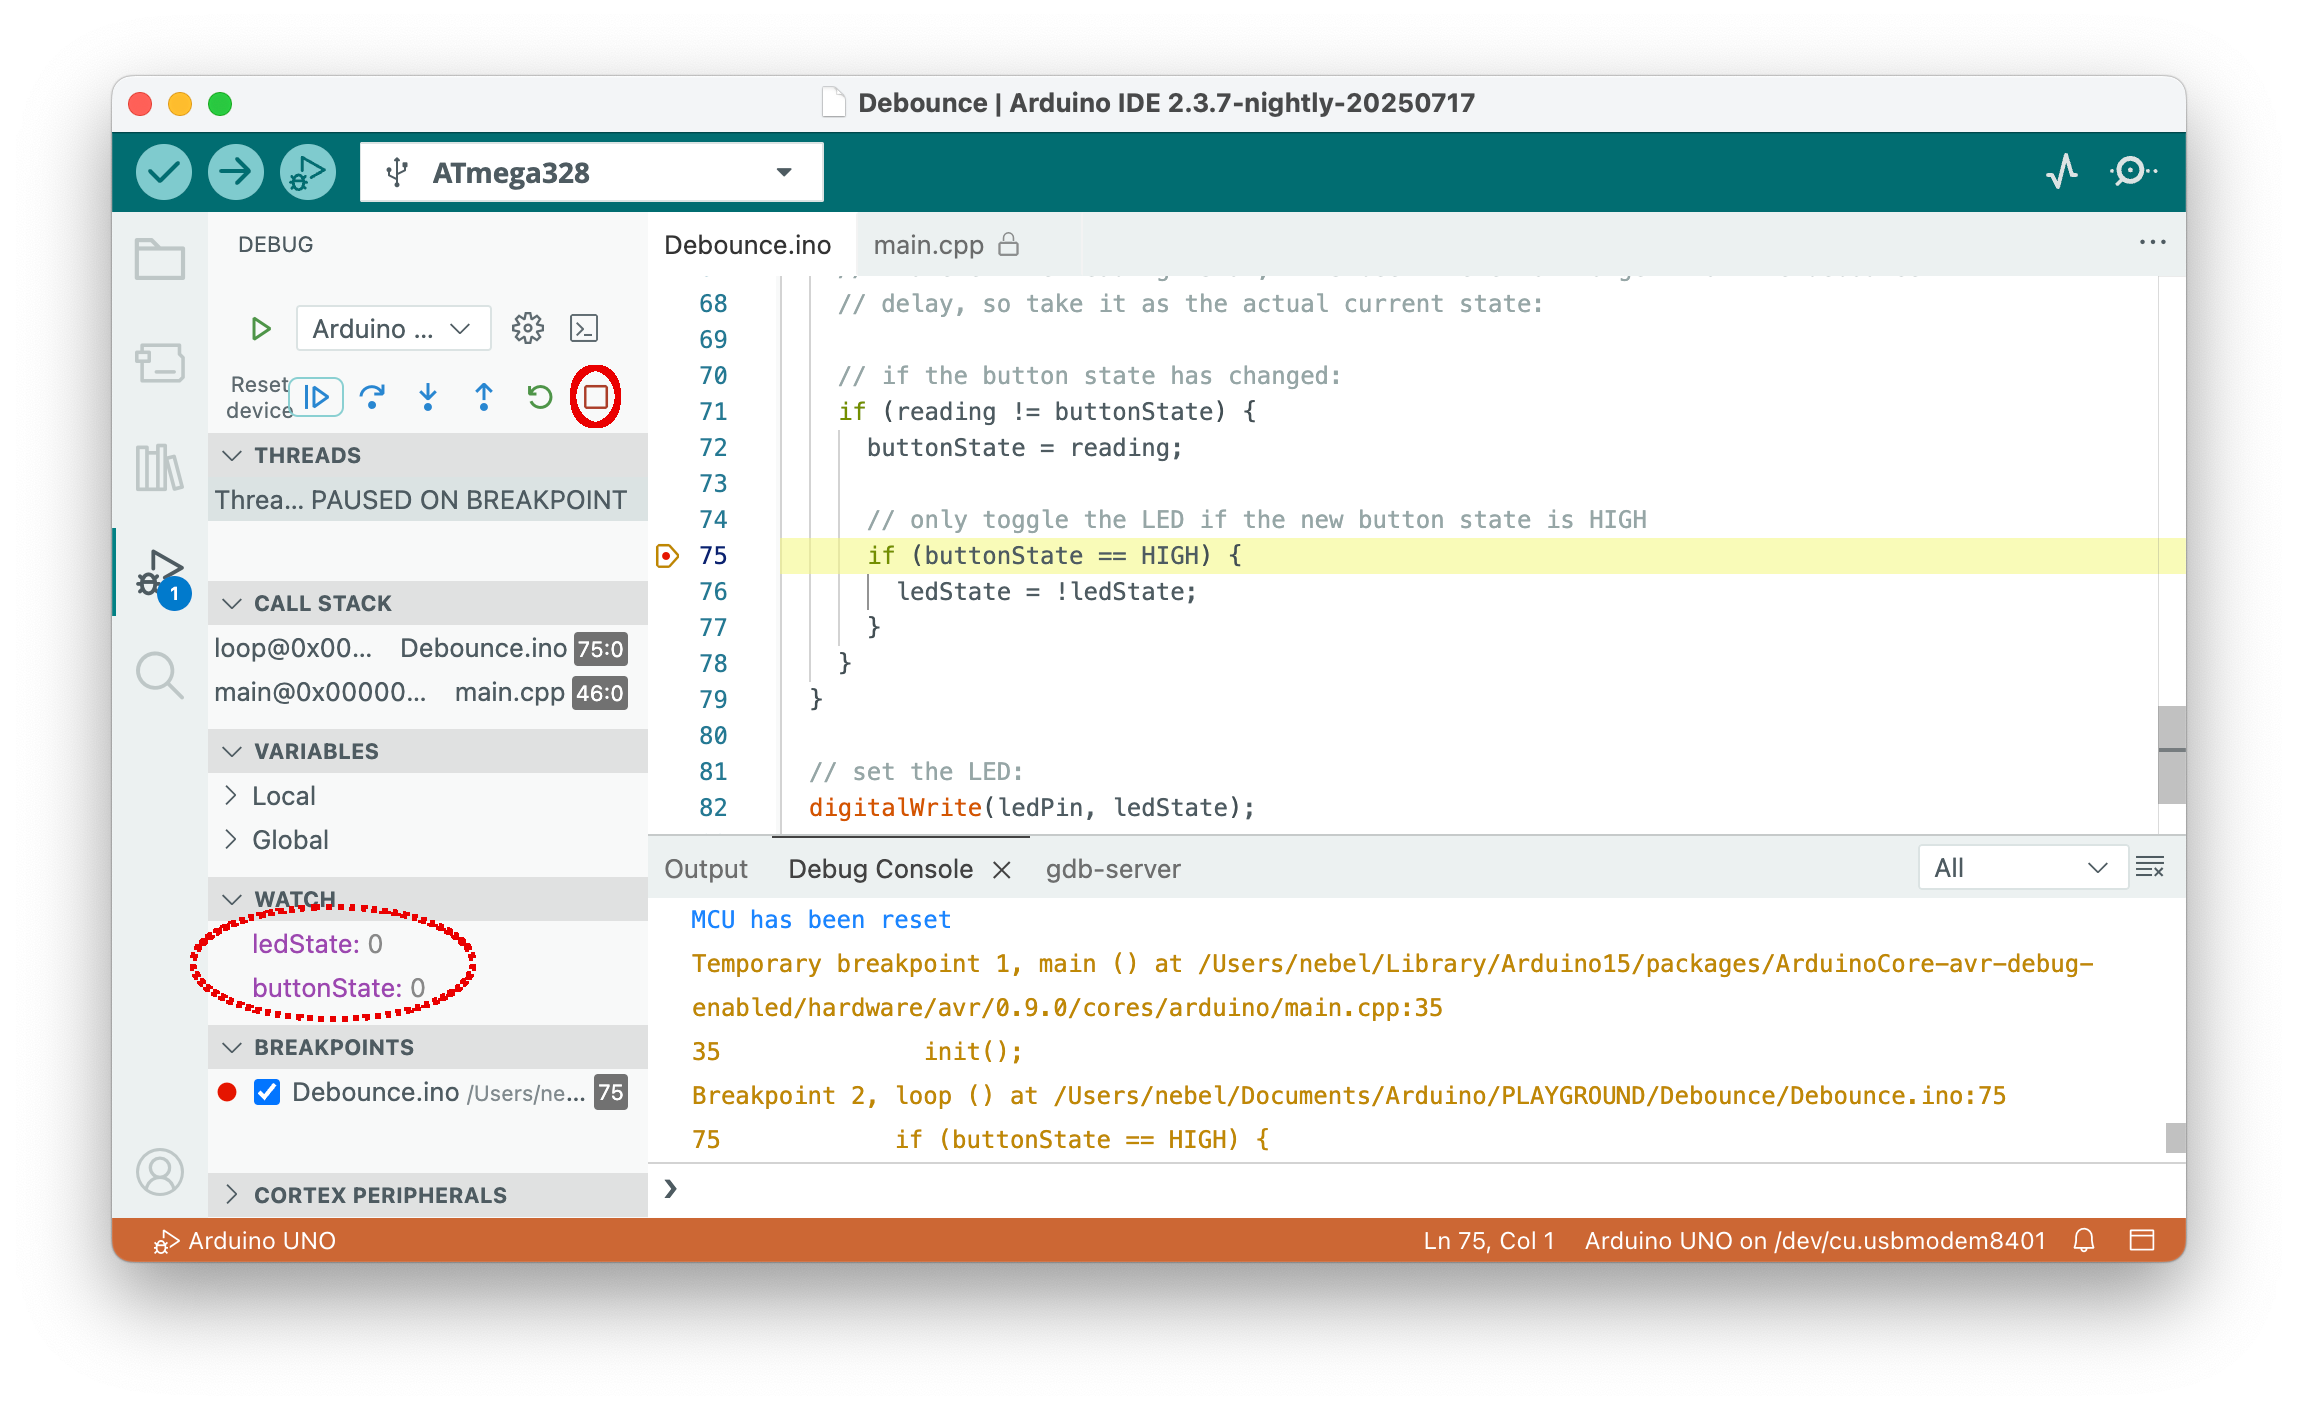
Pressing the button changes the level and will stop again in line 75, as shown below. The value of both variables is now 0. From here on, you can explore the debugger on your own. Hovering the mouse over symbols and names will bring up a short explanation. In this tutorial, we will now stop and press the exit symbol (red square).
Step 6: Start over or terminate the debugging session
You can now edit the sketch and start again at step 4. Note that you always have to recompile and restart the debugger before any changes you made to the sketch are effective. In fact, changing the source text while you are debugging is not a good idea, because the correspondence between the compiled code and the source code will be lost.
Instead of starting a new edit/compile/debug cycle, you may want to call it a day and end debugging. In this case, it may be a good idea to disable the Optimize for Debugging flag in the Sketch menu, because not doing so will result in larger code next time you compile a sketch.
Potential problems
There is always the chance that something goes south, either debugging does not start at all, or something funny happens while debugging. If so, it is a good idea to have a look at the output of the gdb-server console. Messages with the prefix [CRITICAL] often tell what went wrong. It may also be a good idea to consult the Troubleshooting and the Limitations section of the PyAvrOCD manual.
Warning: Do not source attached circuits through the 5V or 3V pin or externally. Use IOREF!
If you have any attached circuitry, be it on a breadboard or a shield, use the IOREF pin to power it.
The reason for this is that the IOREF pin is under the switching control of the onboard debugger. So, if a power cycle is necessary to bring the MCU into debugWIRE mode, then the MCU as well as IOREF will be disconnected from power and then powered again. The 5V/3V pins are not switched and deliver always power. This could lead to the situation that the MCU will be powered through its I/O pins, which is not healthy for the chip and will also prohibit that the MCU switches to debugWIRE mode.
Quickstart guide: dw-link & Arduino UNO R3
This quickstart guide shows how to try out embedded debugging as offered by the Arduino IDE 2 without requiring you to invest in a debug probe. It explains
- how to turn an Arduino UNO R3 into a debugWIRE debug probe using the dw-link firmware,
- how to set up the Arduino IDE 2 so that you can use its debugging feature, and
- how to use this combo in order to do embedded debugging on another Arduino UNO R3.
This means that you need two UNO boards to try out debugging. Of course, any other ATmega328P boards will do, as long as on one of them you can remove or disconnect the RESET ENABLE capacitor (see below).
Required hardware
- Two Arduino UNO R3,
- one USB cable (for the connection to the host),
- a pushbutton that can be plugged into the UNO header,
- 6 jumper wires (male-male),
- a 10 µF electrolyte capacitor (optionally), and
- an LED with a 200 Ω resistor soldered to one leg (optionally).
Step 1: Turning an UNO into a debug probe
The simplest way to install the firmware is to download an uploader from the Release Assets of the dw-link GitHub repo. The uploader should fit your architecture, e.g., dw-uploader-windows-intel64 for Windows. Under Linux and macOS, open a terminal window, go to the download folder, and set the executable permission using chmod +x. Afterward, execute the program. Under Windows, it is enough to start the program after downloading by double-clicking on it.
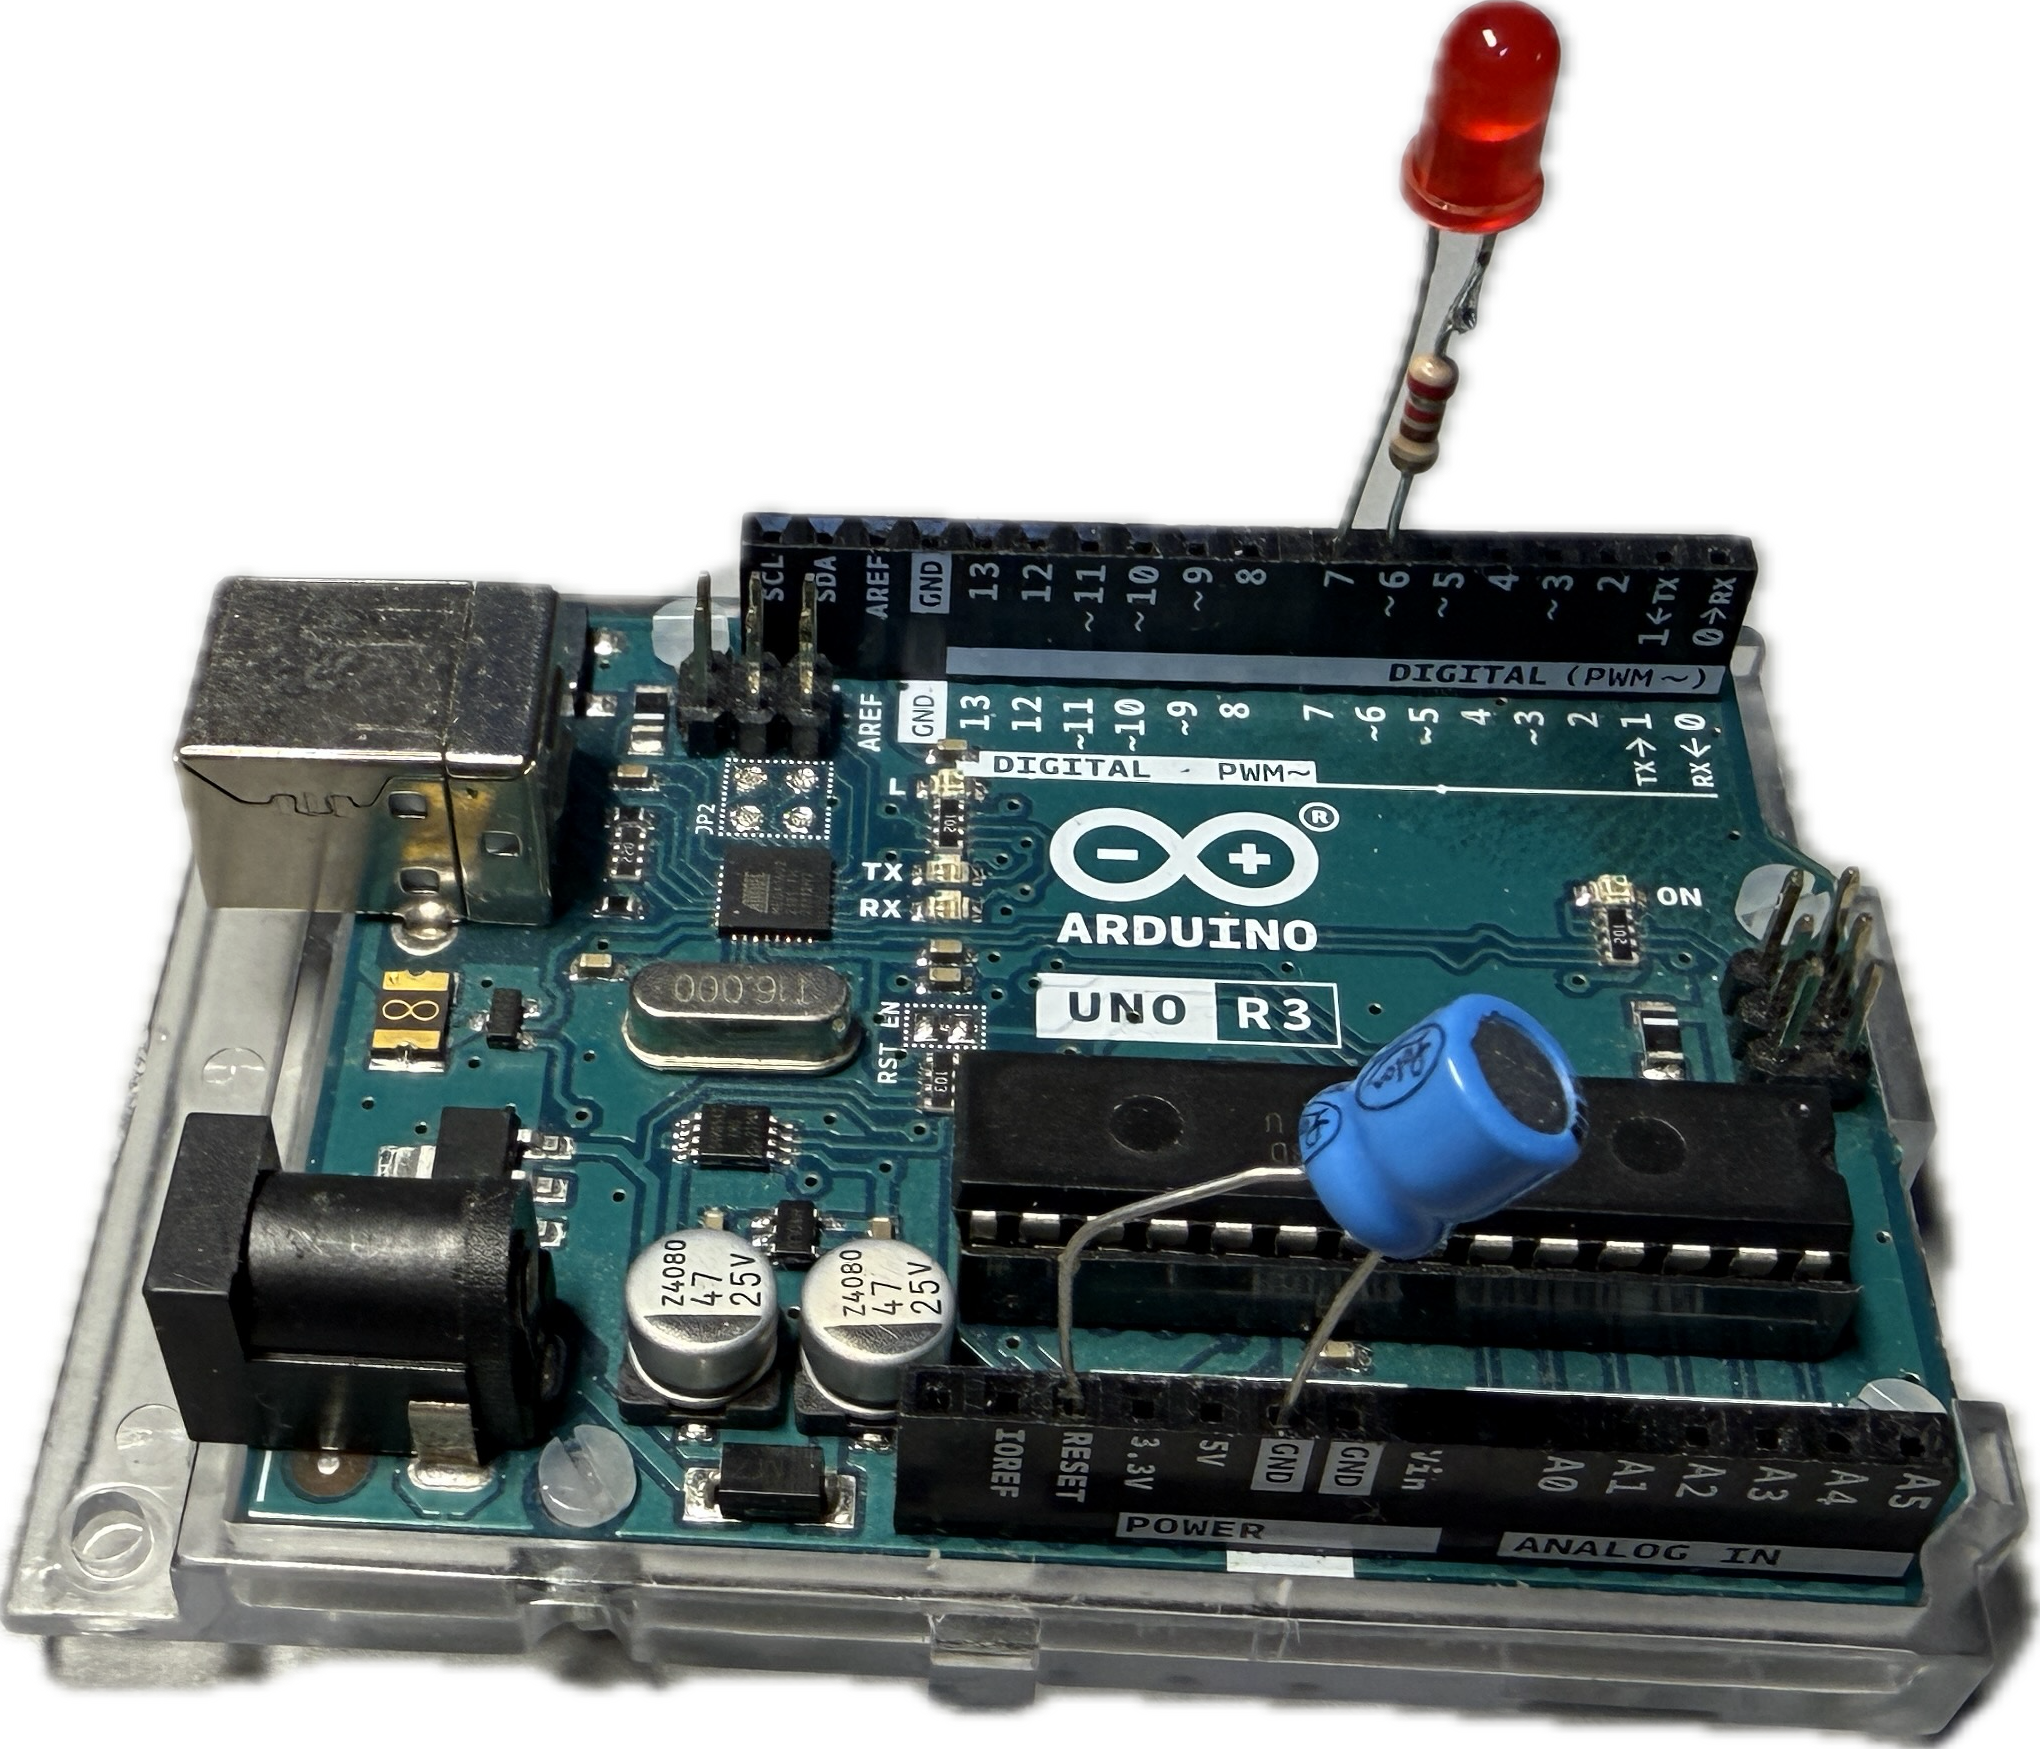
From now on, you can use this board as a debug probe. In order to make it easier to use, plug the (optional) electrolyte capacitor into the RESET and GND header (the negative pin goes into GND). This will make sure that the board does not go into RESET when the host contacts the debug probe. In addition, put the LED with the soldered-on resistor into the header 6 and 7, 6 being used as GND. The LED tells you the internal state of the debug probe:
- debugWIRE mode disabled (LED is off),
- waiting for power-cycling the target (LED flashes every second for 0.1 sec)
- debugWIRE mode enabled (LED is on),
- ISP programming (LED is blinking slowly, 0.5 sec on, 0.5 sec off),
- error state, i.e., not possible to connect to target or internal error (LED blinks furiously every 0.1 sec).
The completed board setup may then look as follows.
Step 2: Extend the list of boards manager URLs
Since the stock Arduino AVR Boards core does not support debugging, we need to shop elsewhere. MiniCore brings support for ATmega328(P)(B) and a few other chips, and is, in addition, debug-enabled. The first step to install it is to extend the list of Additional boards manager URLs. Start the Preferences dialog, which you find, depending on your operating system, either in the Arduino IDE or the File menu.
Now select the field with the additional board manager URLs.
Type the following URL into a new line:
https://mcudude.github.io/MiniCore/package_MCUdude_MiniCore_index.json
You close the dialog by clicking on two OK buttons in succession.
Step 3: Install the debug-enabled MiniCore
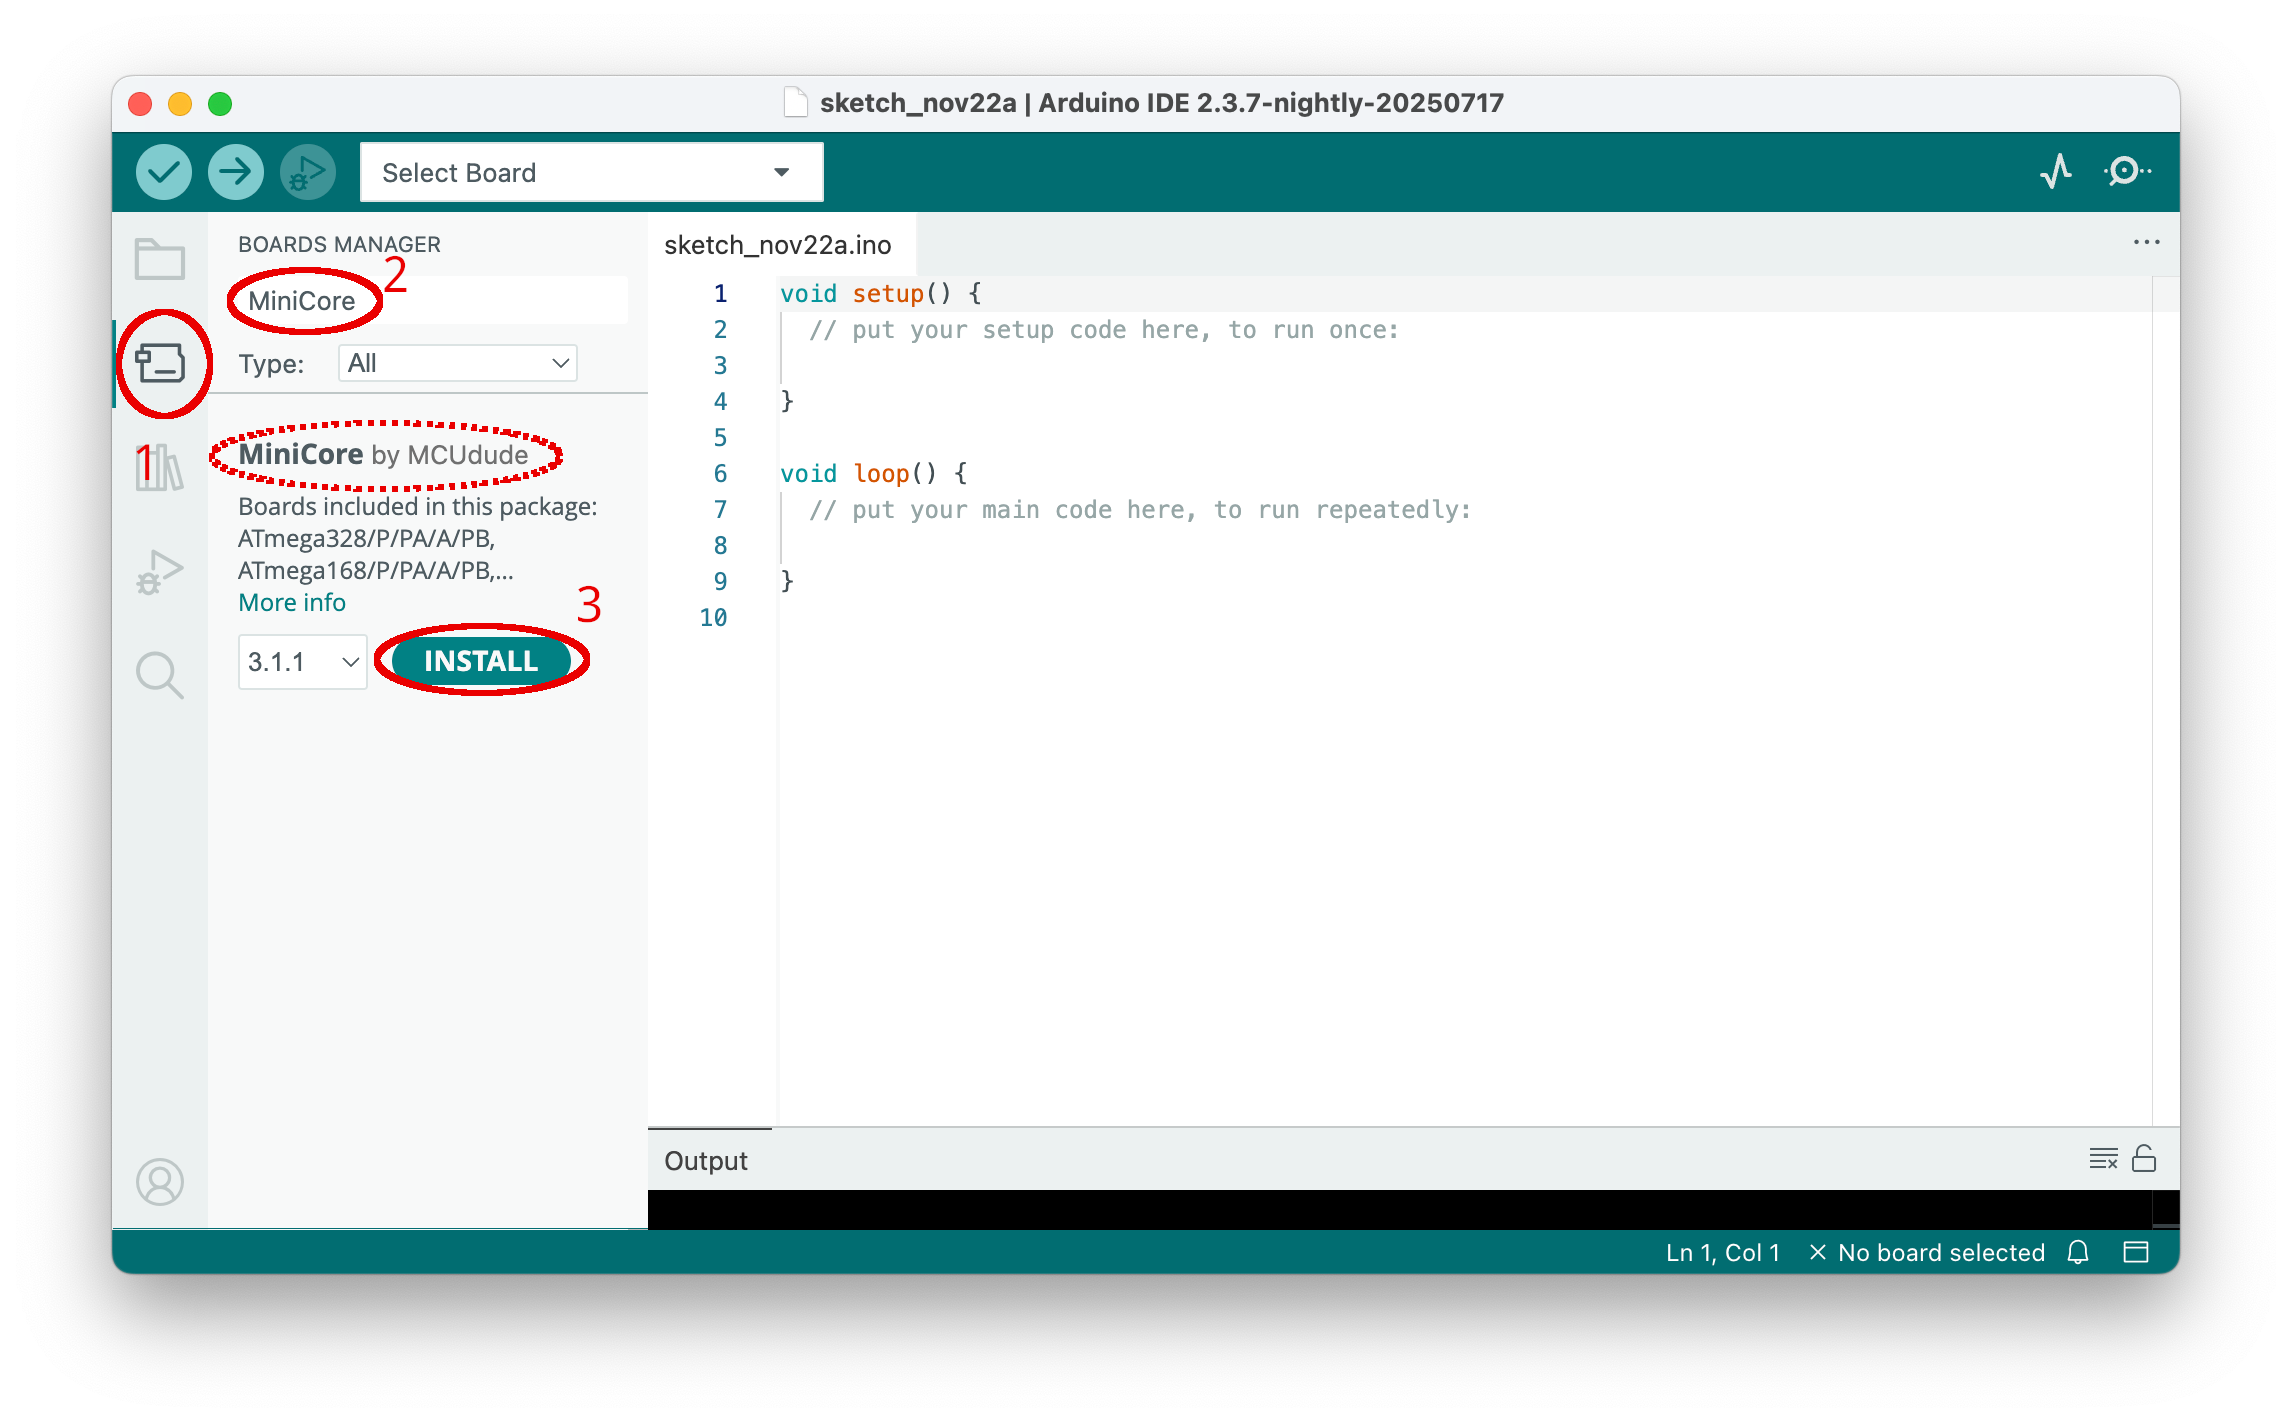
Now you need to activate the boards manager by clicking on the board symbol in the left side bar (1). After the boards manager pane has been opened, type "MiniCore" into the search line (2). Install MiniCore by clicking on Install (3).
Loading MiniCore and all the necessary tools might take a while.
Step 4: Prepare the target board for debugging
On an original UNO board, you need to cut a solder bridge labeled RESET EN in order to disconnect the auto-RESET enabling capacitor.
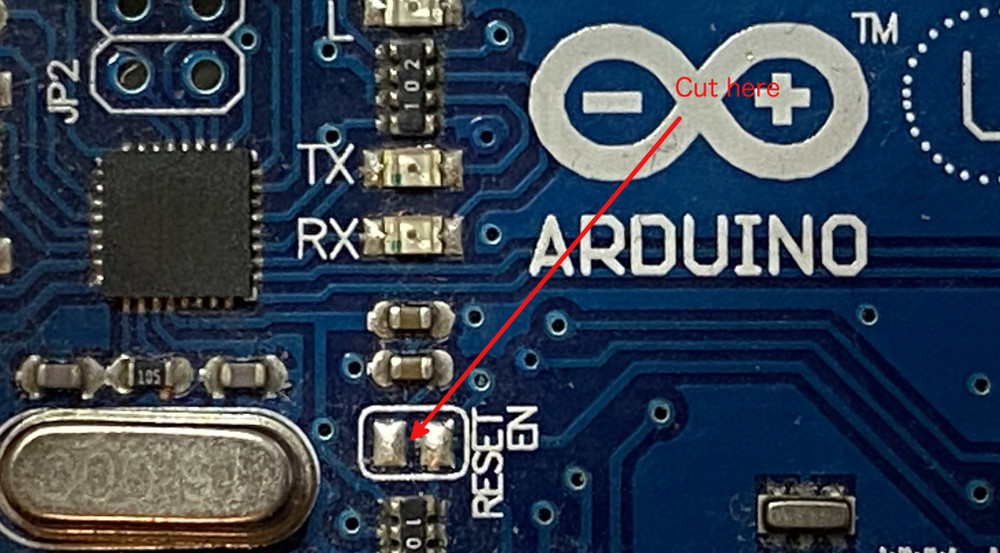
On other boards, similar modifications are most likely necessary.
Warning
Not disconnecting the capacitor (or other loads) from the RESET line of the MCU may lead to the situation that debugWIRE mode is activated on the MCU, but it is impossible to communicate with the MCU. In particular, one cannot leave debugWIRE mode anymore.
In addition to these physical modifications, we also want to add a pushbutton, with one pin going into digital header slot 2 of the board. The other pin needs to be connected to GND. In my case, I use the header slot 4, which then has to be an output, which is LOW.
Step 5: Connect the target board with the debug probe
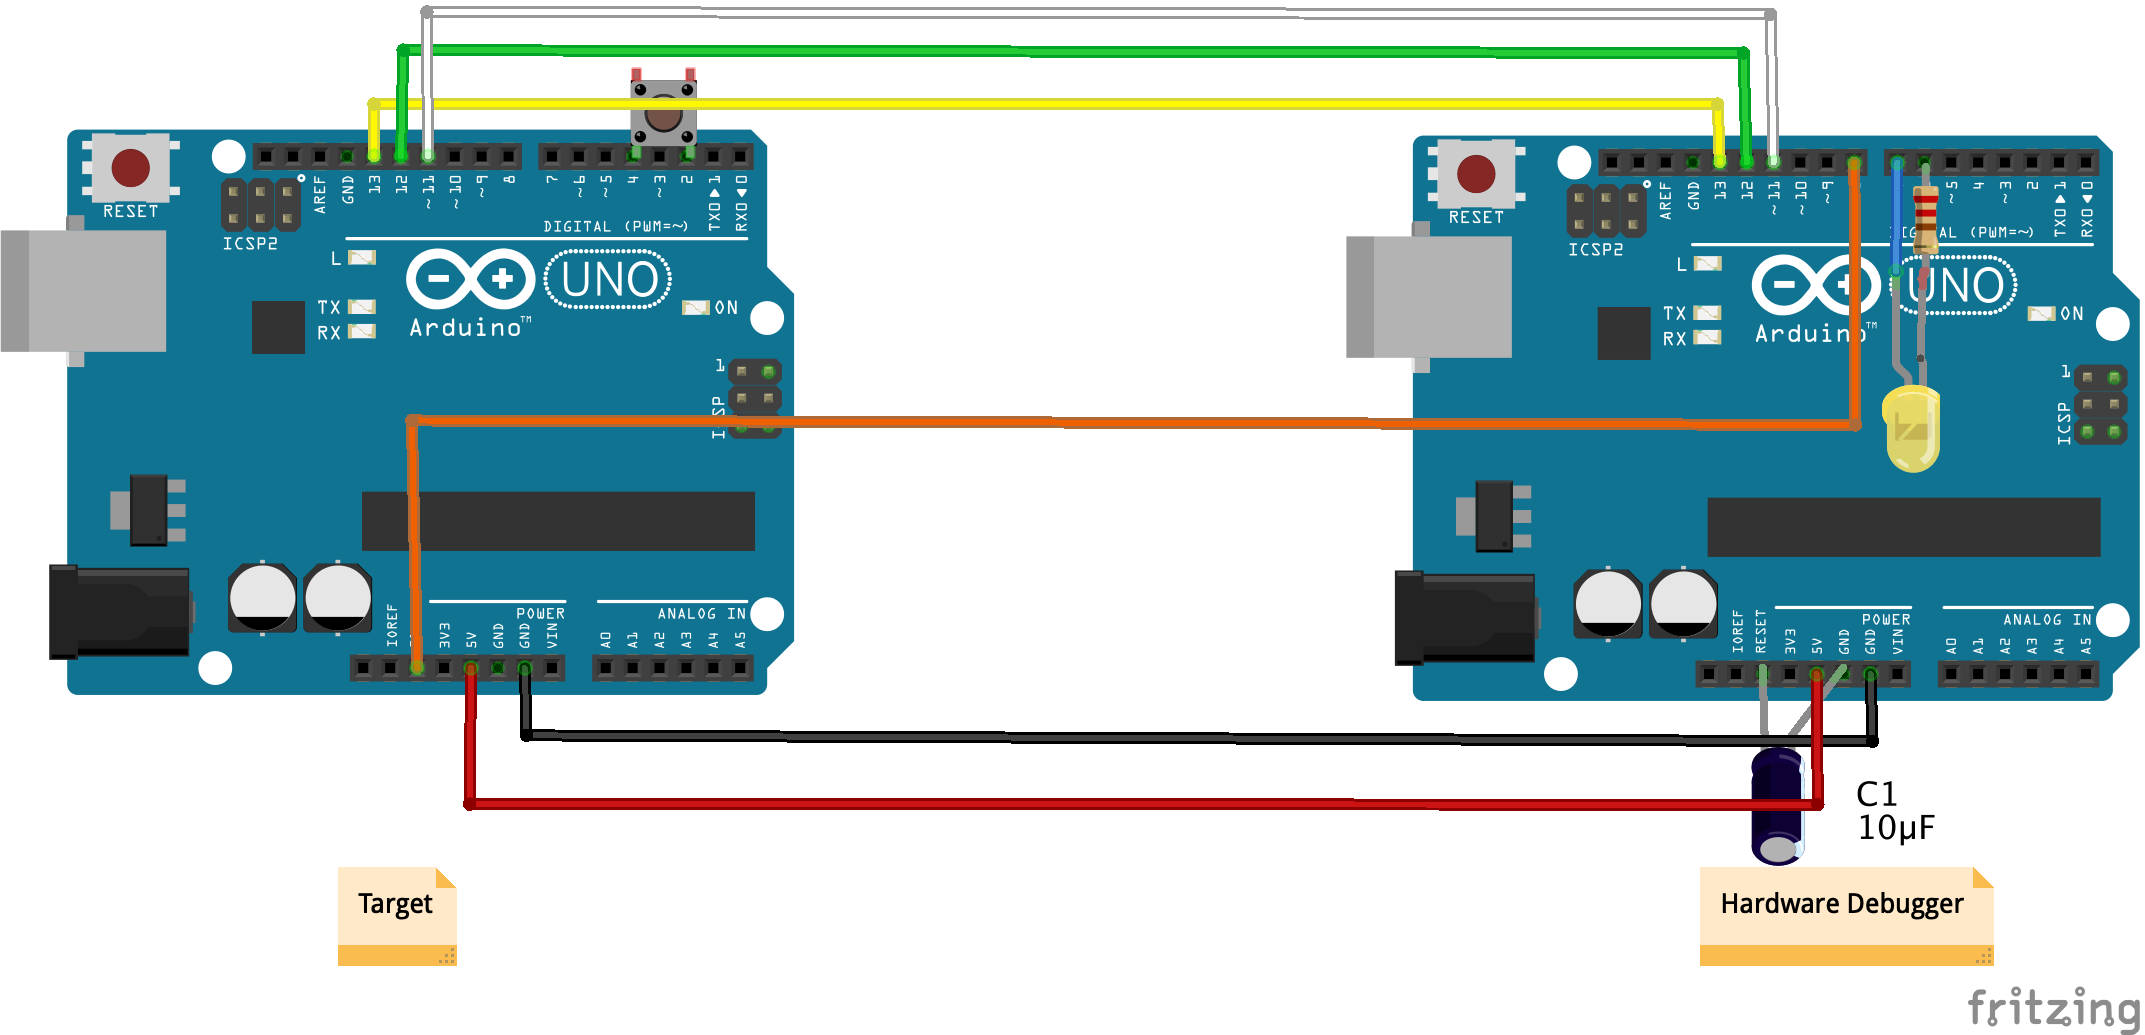
Connecting the target and debug probe boards is not entirely straightforward. You have to connect all ISP connections, except for the RESET line. This goes into the header slot 8 on the debug probe. A Fritzing sketch looks as follows.
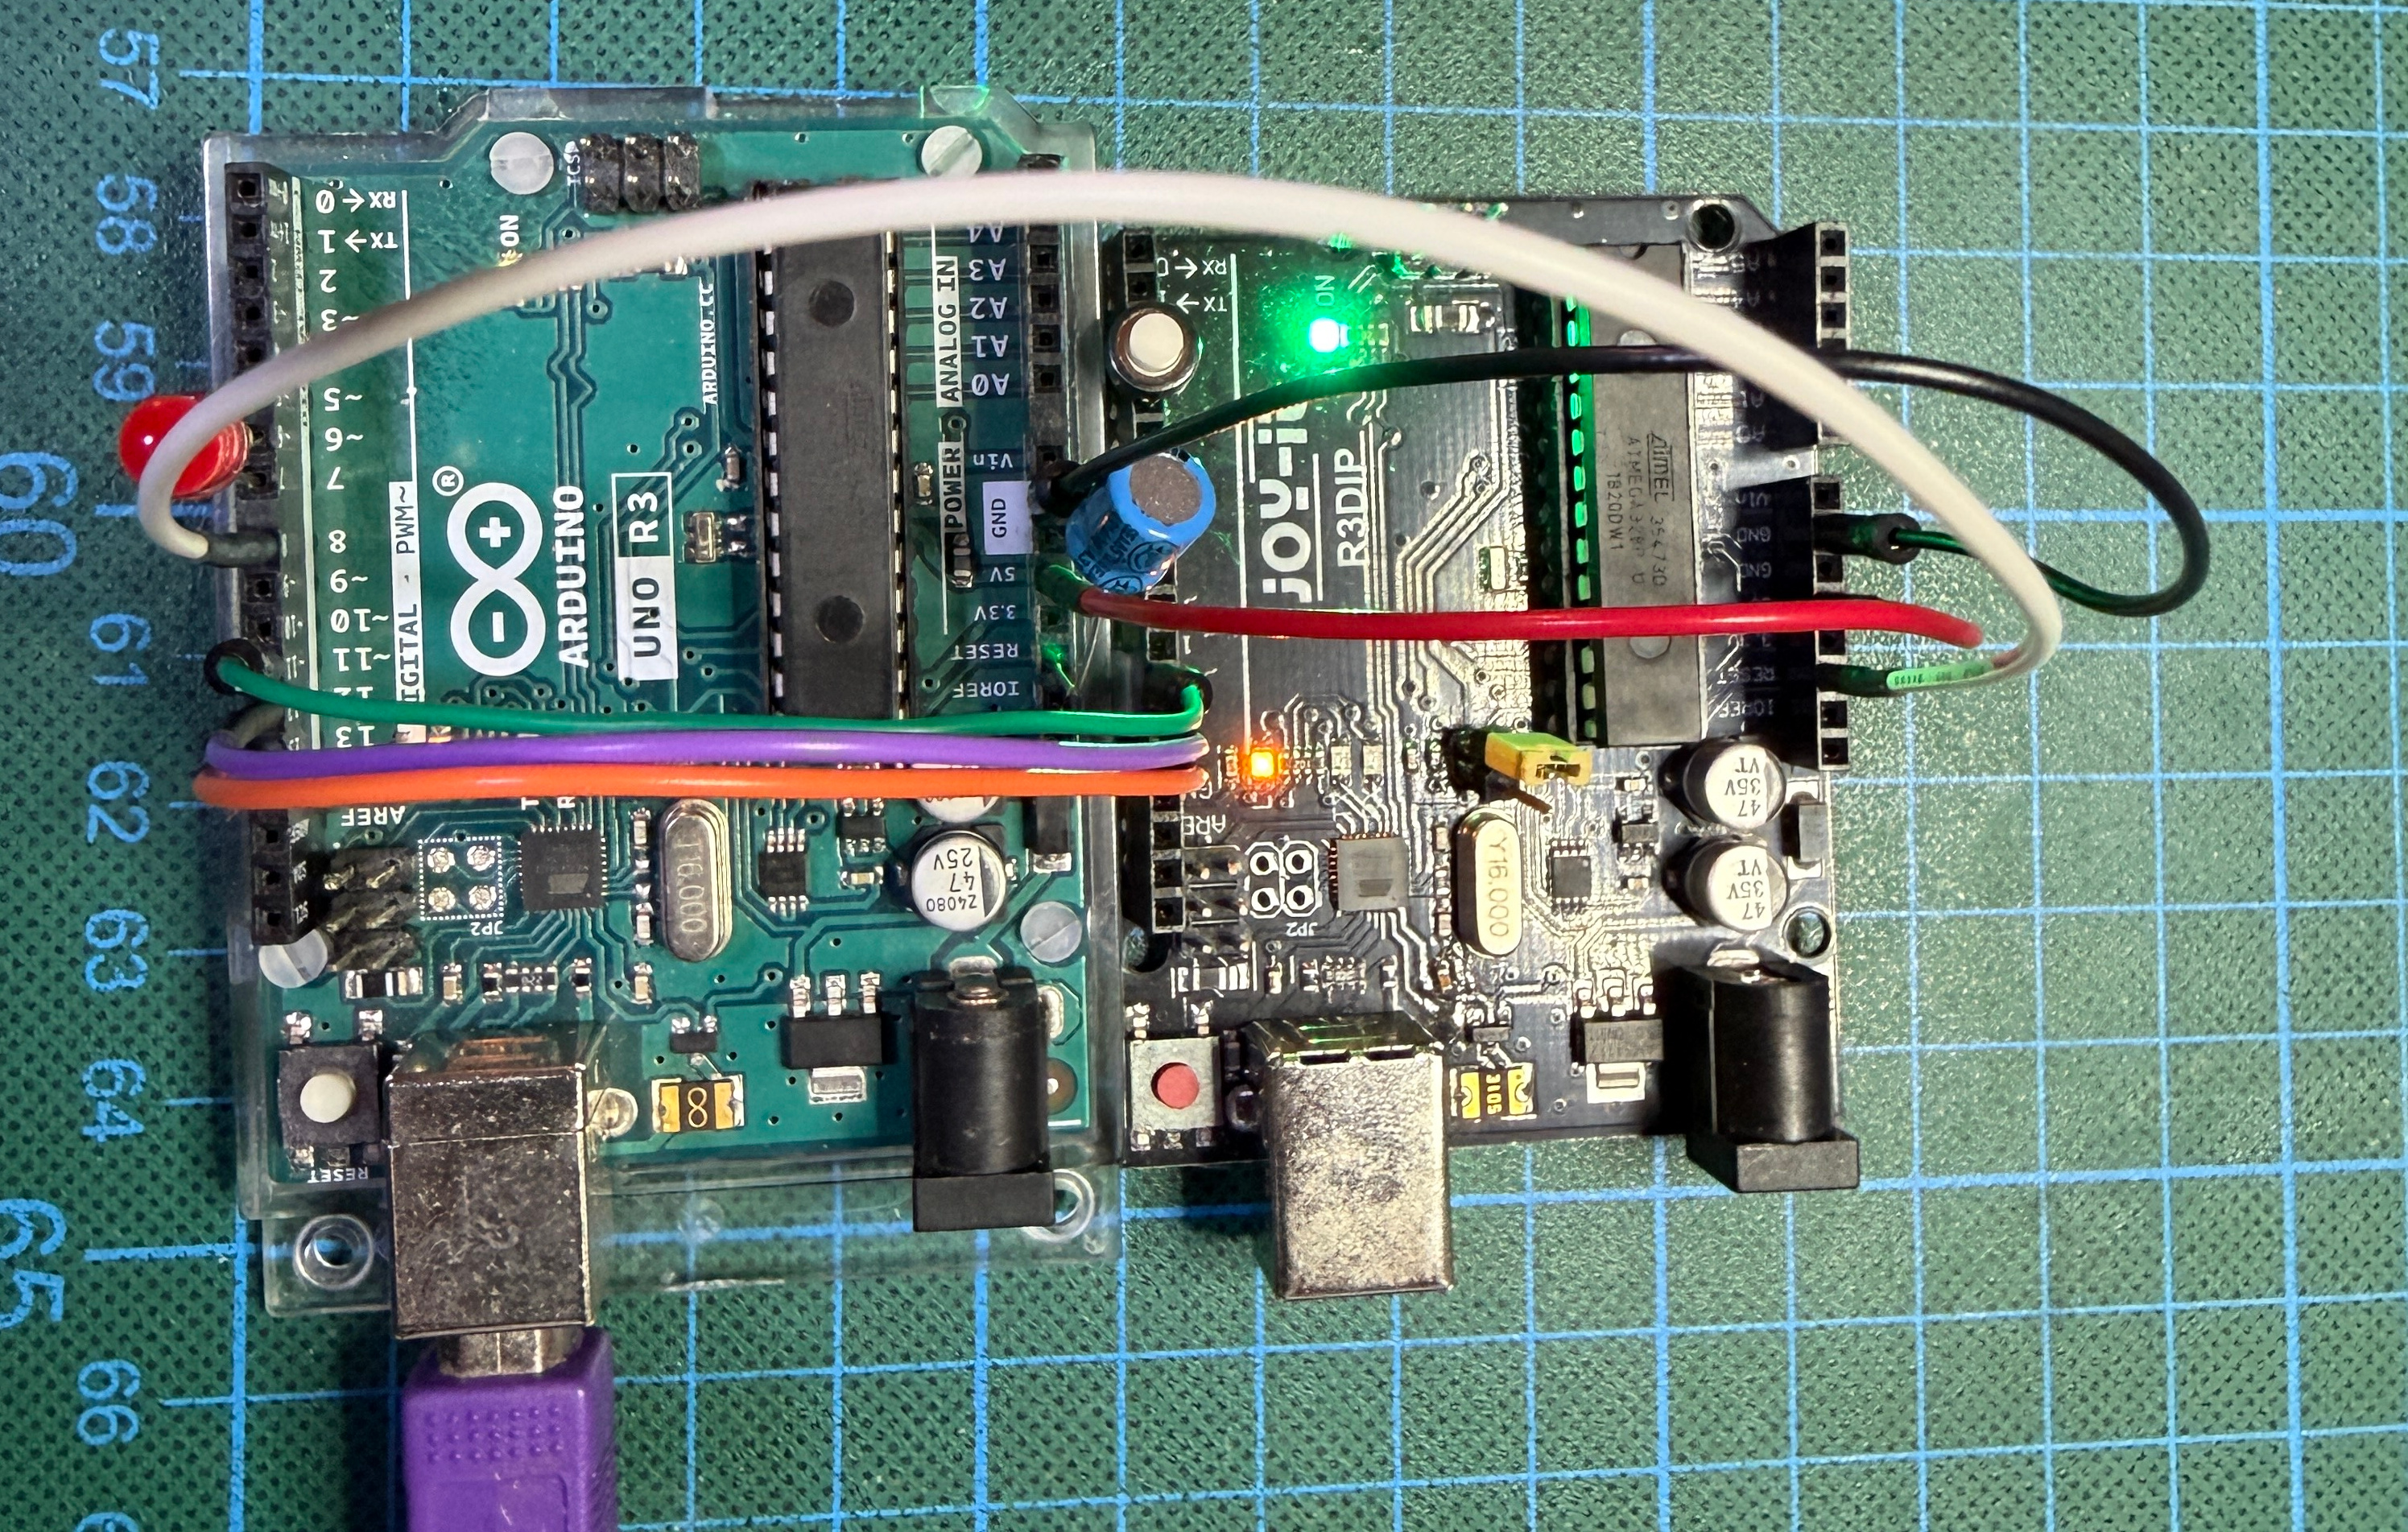
The USB connector must be plugged into the hardware debugger. In reality, this could look like the following.
Step 6: Select the board type
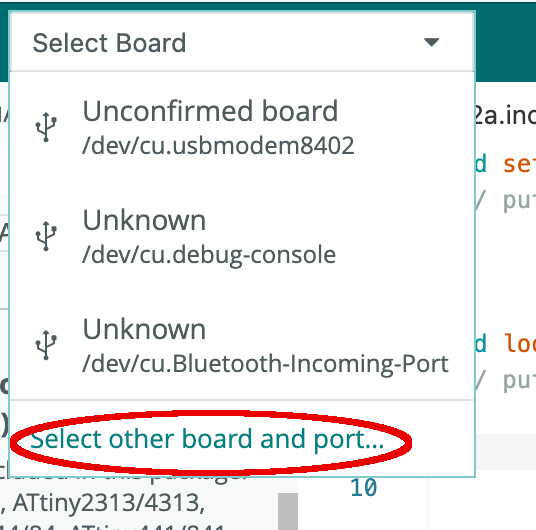
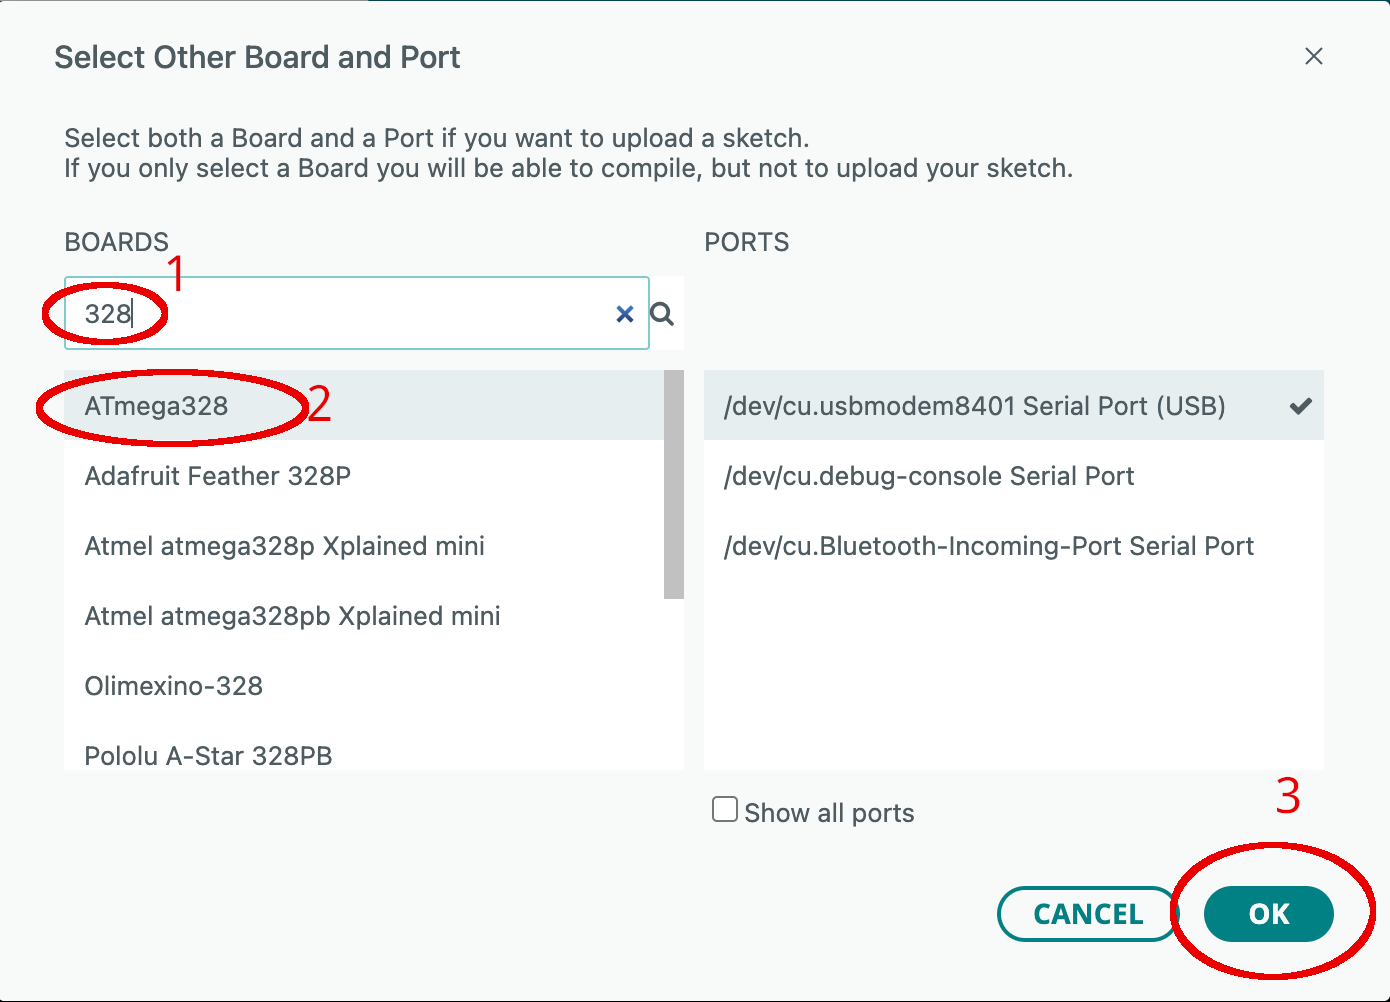
After having set up the hardware, you have to select the right board. First, click on Select Board in the top bar and choose Select other board and port ....
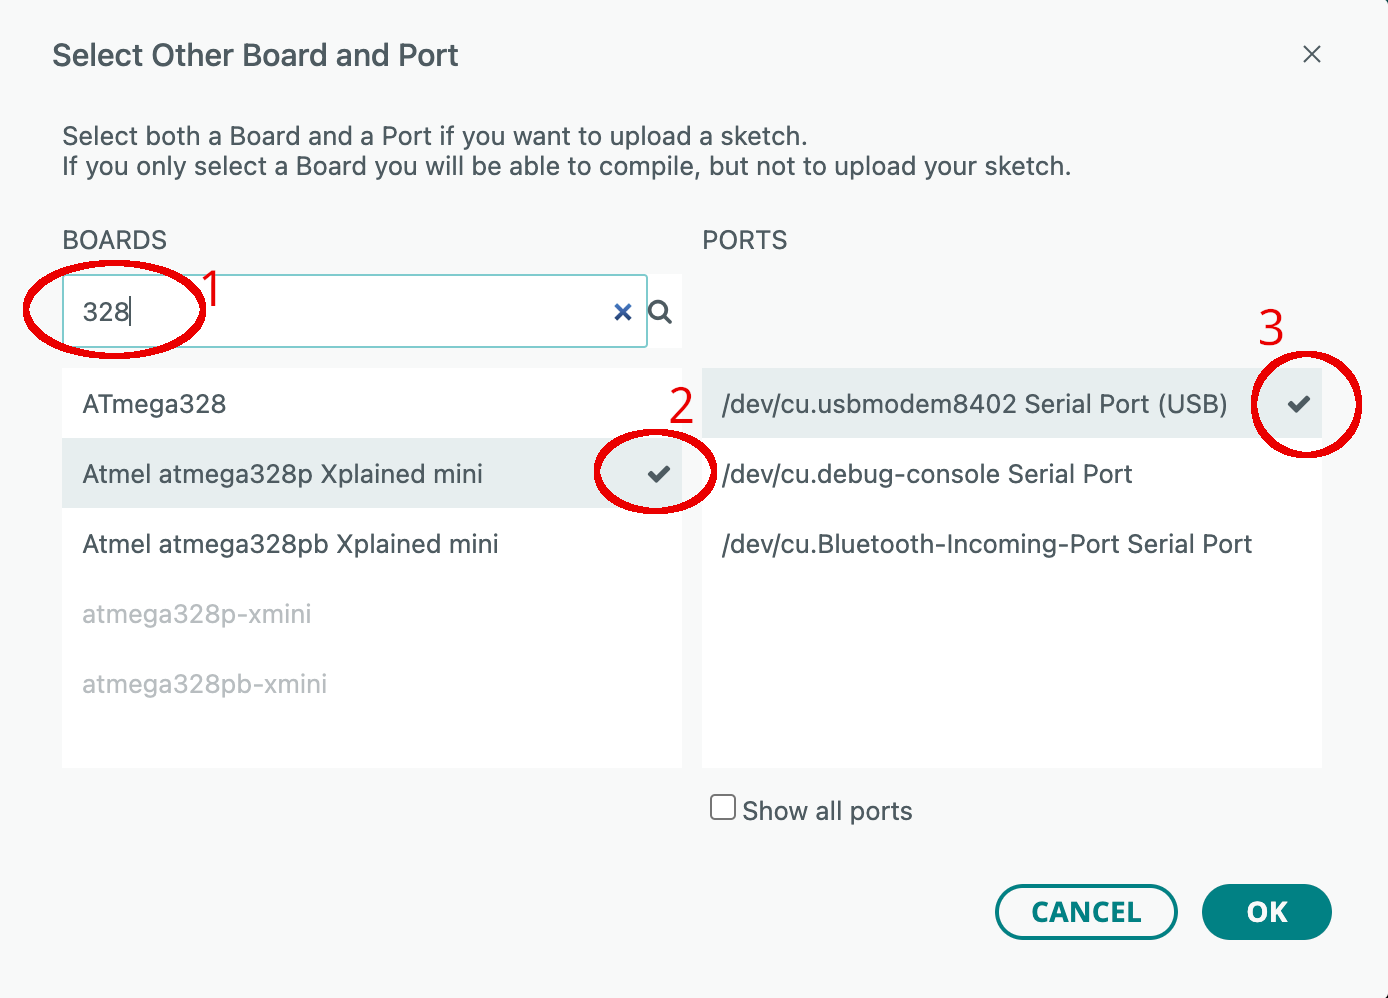
Then type "328" in the search field (1), select the right board (2), and finally click the OK button. We do not care much about the serial port. However, we might as well select the serial line that is connected to our debug probe.
Step 7: Edit and compile a sketch
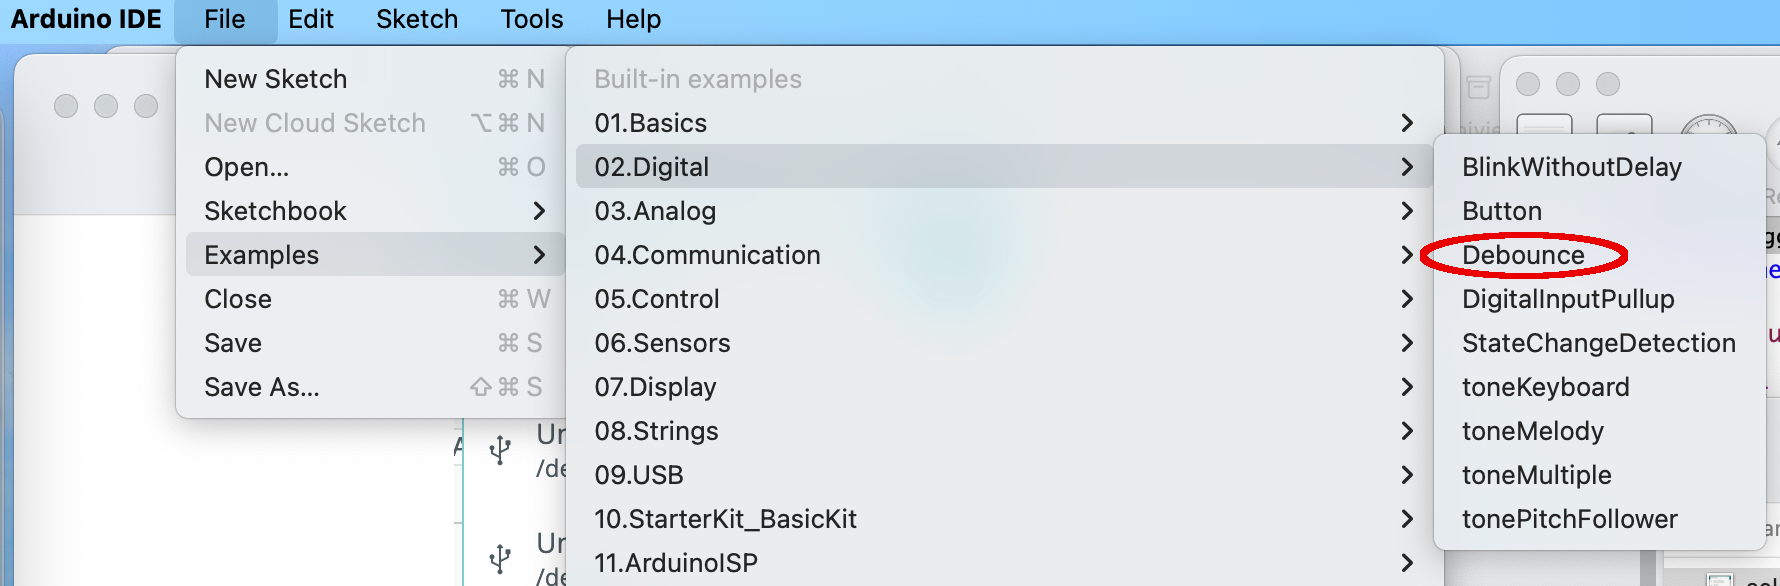
Let us choose a simple sketch that is a little bit more challenging than the Blink example. The Debounce example will do. Let us load it and modify it for our needs.
This sketch will toggle the LED state (on pin 13) when a button is pressed. The program logic contains a basic form of debouncing so that noise induced by the button contact opening and closing is ignored. The button in this sketch is supposed to be at digital input line 2. As mentioned above, the GND pin shall be the header slot 4. For this reason, we replace the empty line 32 in the Debounce.ino sketch with the following line
const int buttonGND = 4; // the number of the pushbutton GND pin
Further, we need to replace line 45 with
pinMode(buttonPin, INPUT_PULLUP);
and the empty line 47 with
pinMode(buttonGND, OUTPUT);
Before compiling and uploading the sketch, you should set the Optimize for Debugging flag in the Sketch menu. This flag will make sure that the produced machine code resembles the program flow in the source code in order to make debugging easier.
Now it is time to compile the sketch. Click the Verify button (a check mark symbol) in the top bar, which will compile the sketch. Loading the compiled code will then be done when the debugger is started.
Step 8: Start debugging
Now it is time to start debugging by clicking the Debug button (bug in front of a triangle) in the top row.
Then the IDE tries to discover a debug probe. If it finds one, it will connect and check whether the target is already in the debugWIRE mode. If this is not the case, the IDE requests a power cycle, i.e., disconnecting power from the target board and then reconnecting power. The debug probe dw-link will start to flash every second.
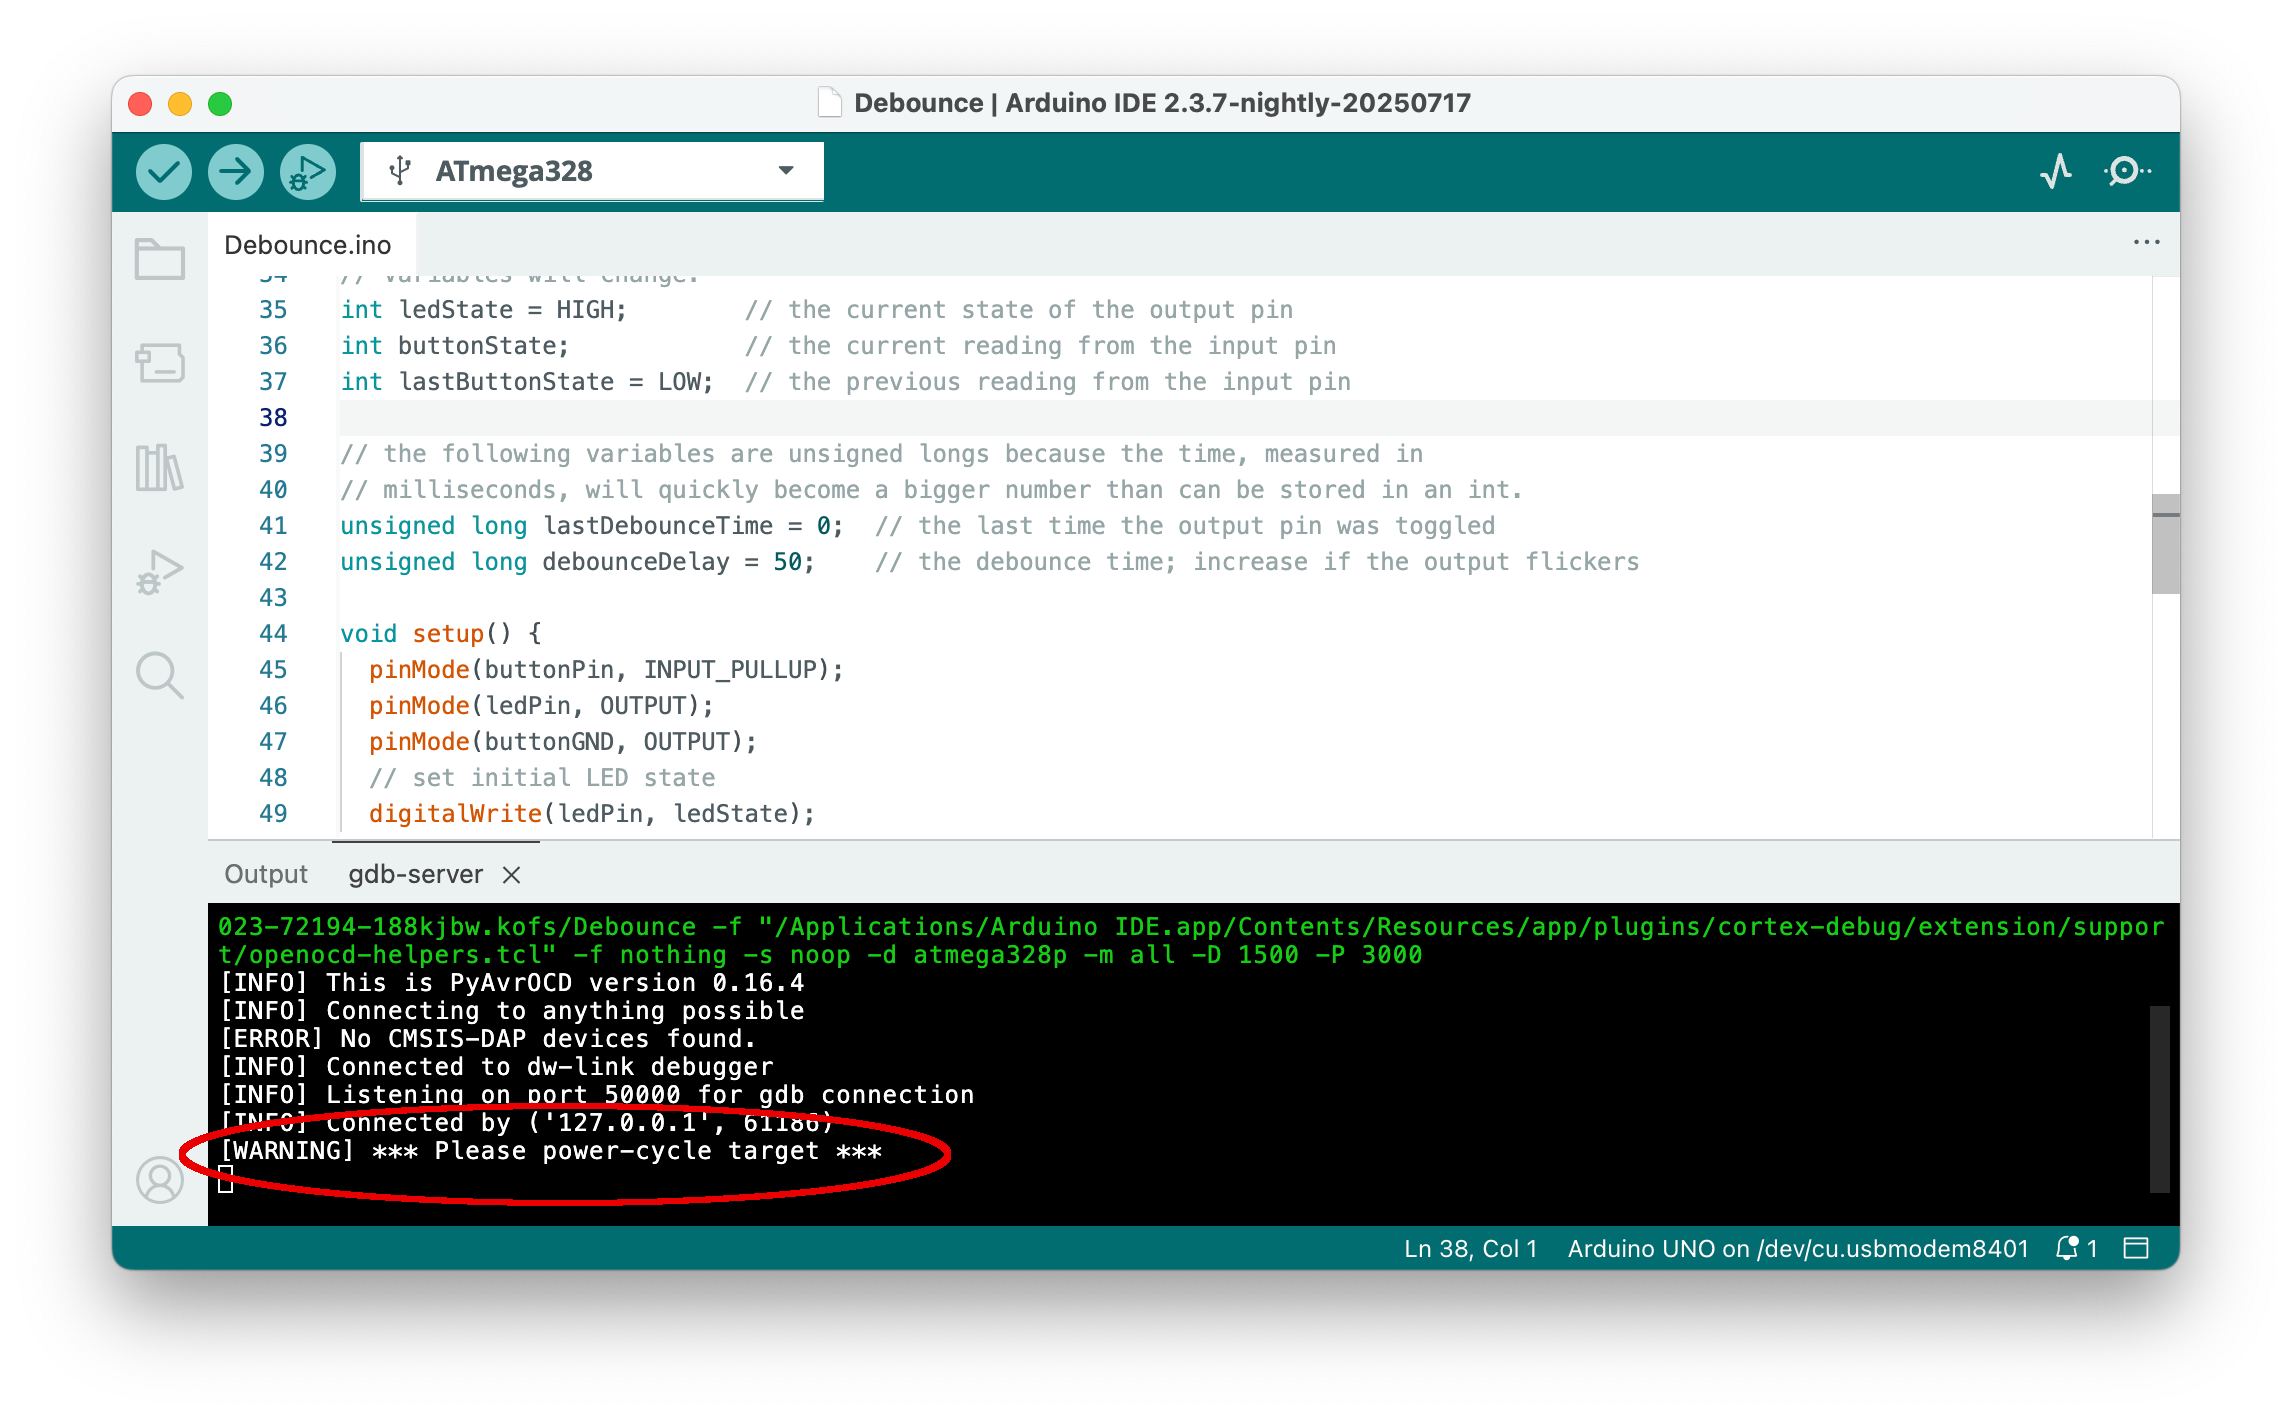
Power-cycling is something you have to do manually by removing the jumper cable and reinserting it. Sometimes, this does not work out according to plan, and an error message is issued. Usually, at a second attempt, it works out with the MCU already being in debugWIRE mode.
Step 9: Debug the sketch
If the debugger has successfully started and the binary has been loaded into flash, execution will begin. It will always stop in the first line of the main function in main.cpp, which is an Arduino internal function. The line where execution has been stopped is marked yellow (perhaps with an additional yellow triangle) (A). Since this line is in a file different from the user sketch, it is loaded into the editor, and the loaded files are all shown in the top bar of the editor (B). The central debugging control is located in the debugging pane at the top (C). The buttons have the following meanings, from left to right:
- Resetting the device
- Continue execution or pause
- Step over: execute one source line
- Step into: execute stepping into the function, if in this line one is called
- Step out: finish the current function and stop after the line where it was called
- Restart: Same as Reset
- Stop: Terminate debugging
Pressing the Continue button in the situation depicted in the picture above would start execution. However, before we do this, let us set a breakpoint. For this purpose, we first select the original sketch file Debounce.ino at the top row of the editor pane.
This will bring up the sketch file. Scroll down to line 75 and set a breakpoint by clicking to the left of the line number (1). A red dot will mark the breakpoint. Now press the Continue button (2).
Sketch execution will be immediately stopped in line 75. Now we want to examine the values of some of the variables. If you hover the mouse over a variable, its value will be shown. If we wish always to track the value of the variable, we can use the watch window. Move with the mouse to the correct part of the WATCH bar. Then a plus sign will appear. Clicking on it allows you to enter "watch" expressions.
If we add buttonState and ledState to the WATCH pane, we see that they are both currently 1. If we now click the Continue button, the ledState variable will be toggled (i.e., the LED will go dark) and the sketch will run and wait for a change of the button state.
Pressing the button changes the level and will stop again in line 75, as shown below. The value of both variables is now 0. From here on, you can explore the debugger on your own. Hovering the mouse over symbols and names will bring up a short explanation. In this tutorial, we will now stop and press the exit symbol (red square).
Step 10: Start over or terminate the debugging session
You can now edit the sketch and start again at step 7. Note that you always have to recompile and restart the debugger before any changes you made to the sketch are effective. In fact, changing the source text while you are debugging is not a good idea, because the correspondence between the compiled code and the source code will be lost.
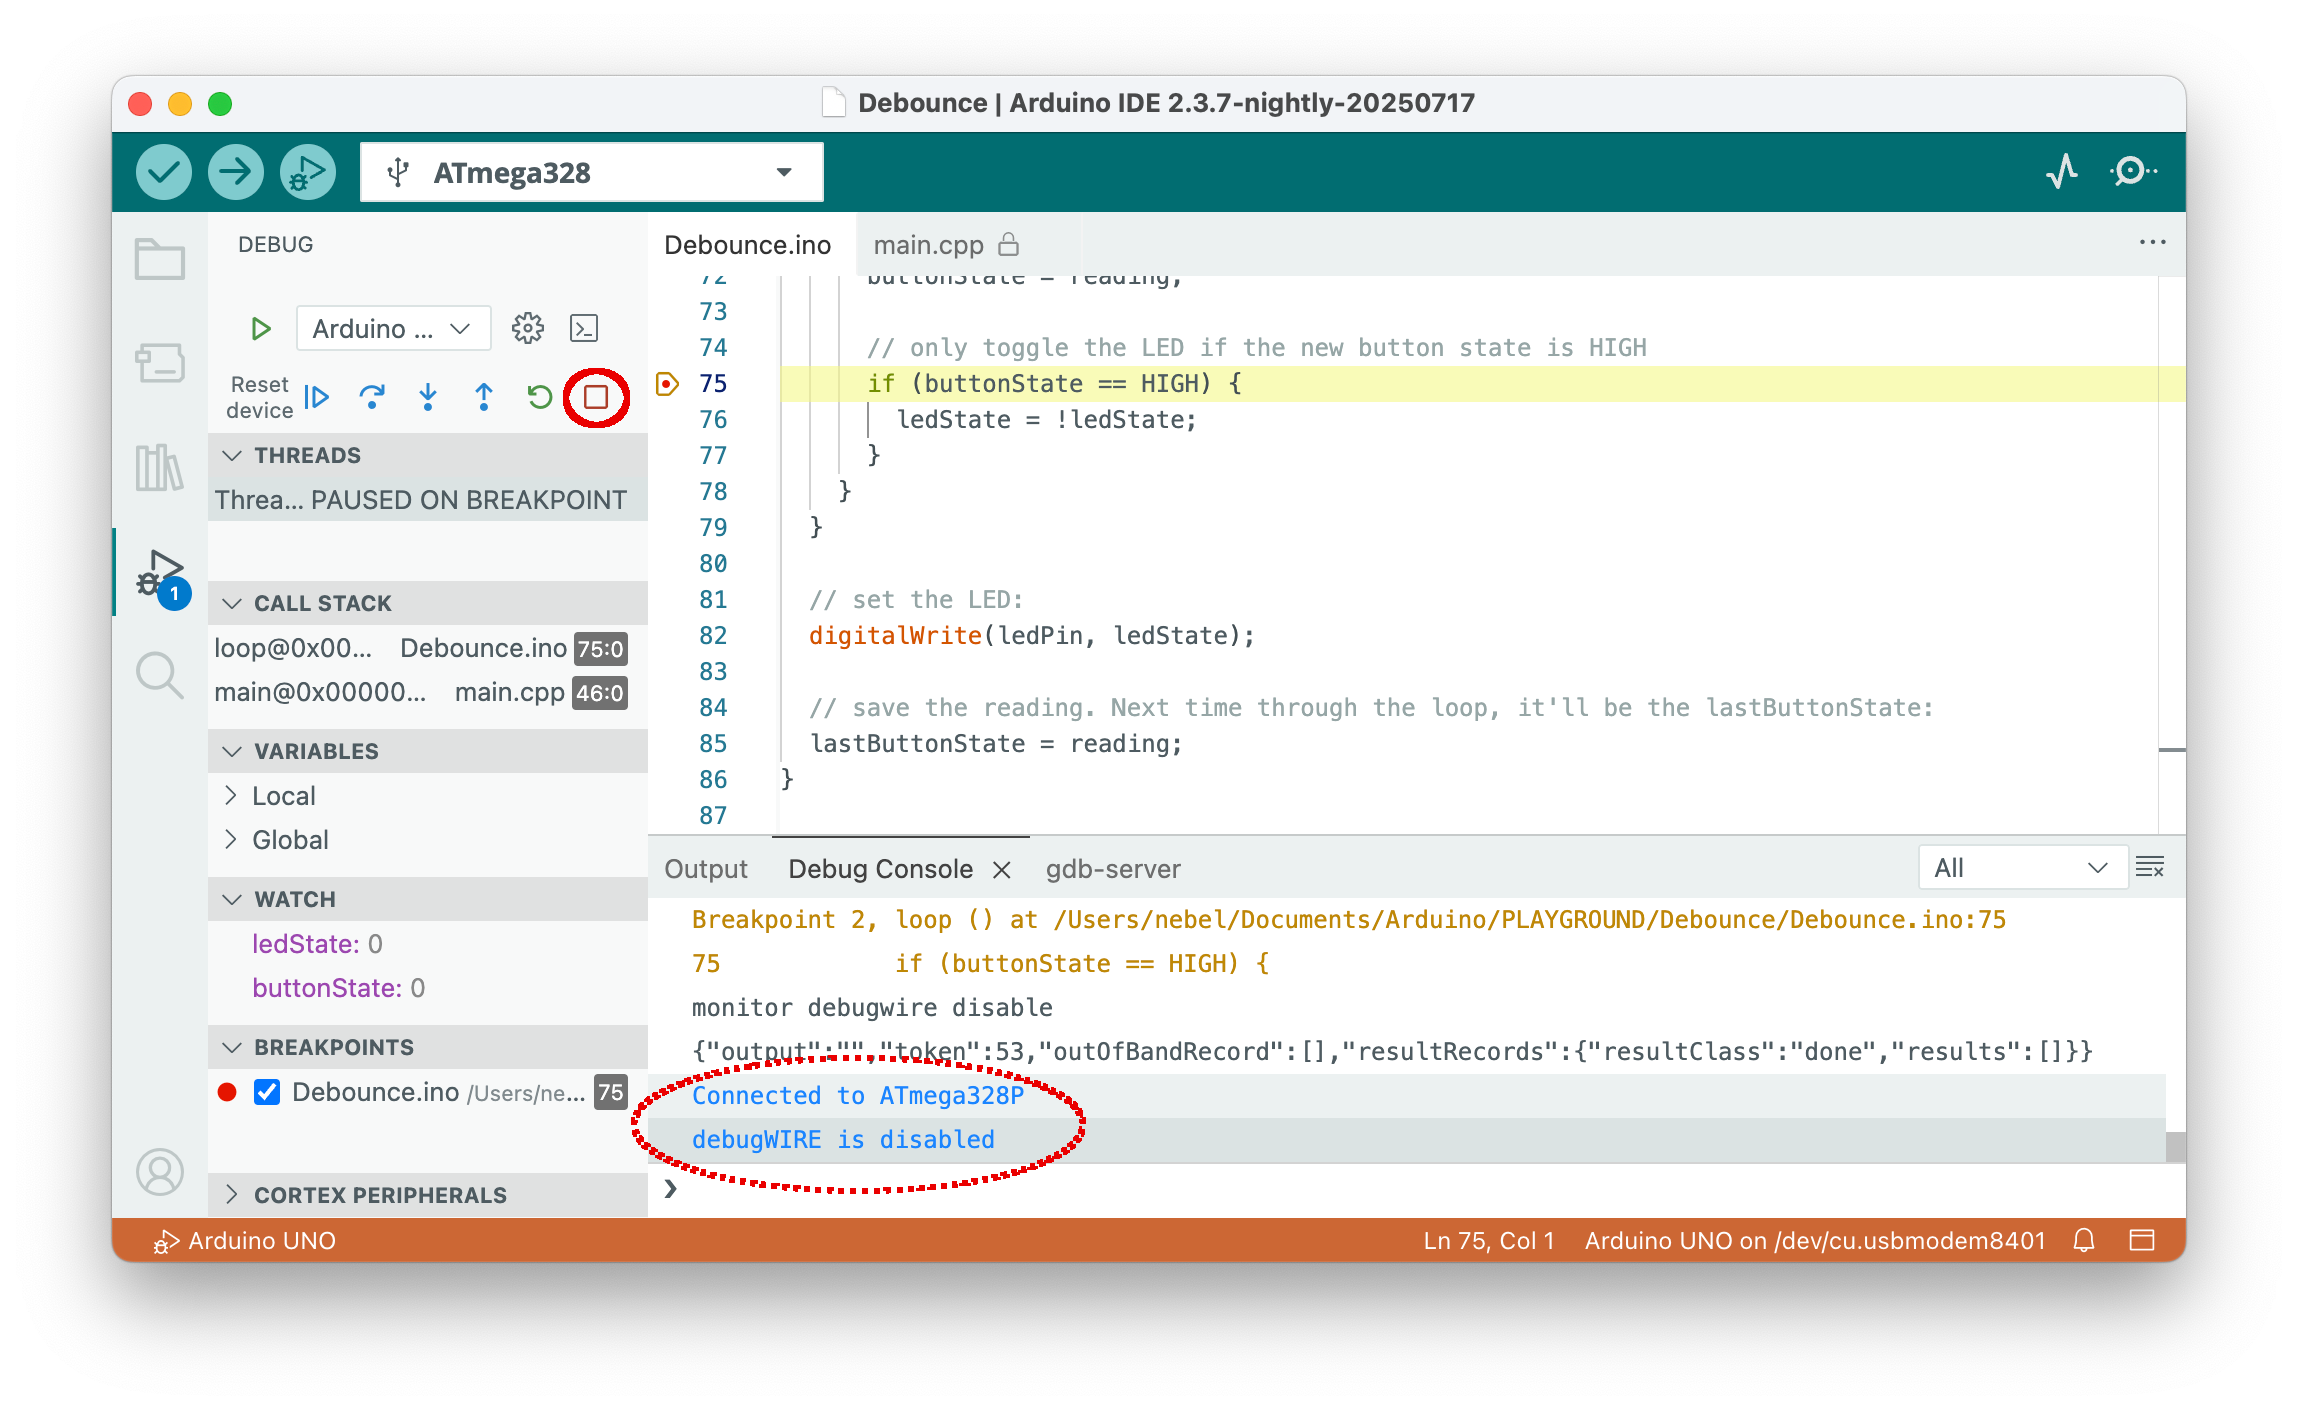
Instead of starting a new edit/compile/debug cycle, you may want to call it a day and end debugging. In this case, you want perhaps to switch the MCU back from debugWIRE mode to normal mode, in which SPI programming is possible. In order to achieve that, type monitor debugwire disable into the prompt line of the Debug Console before ending the debug session.
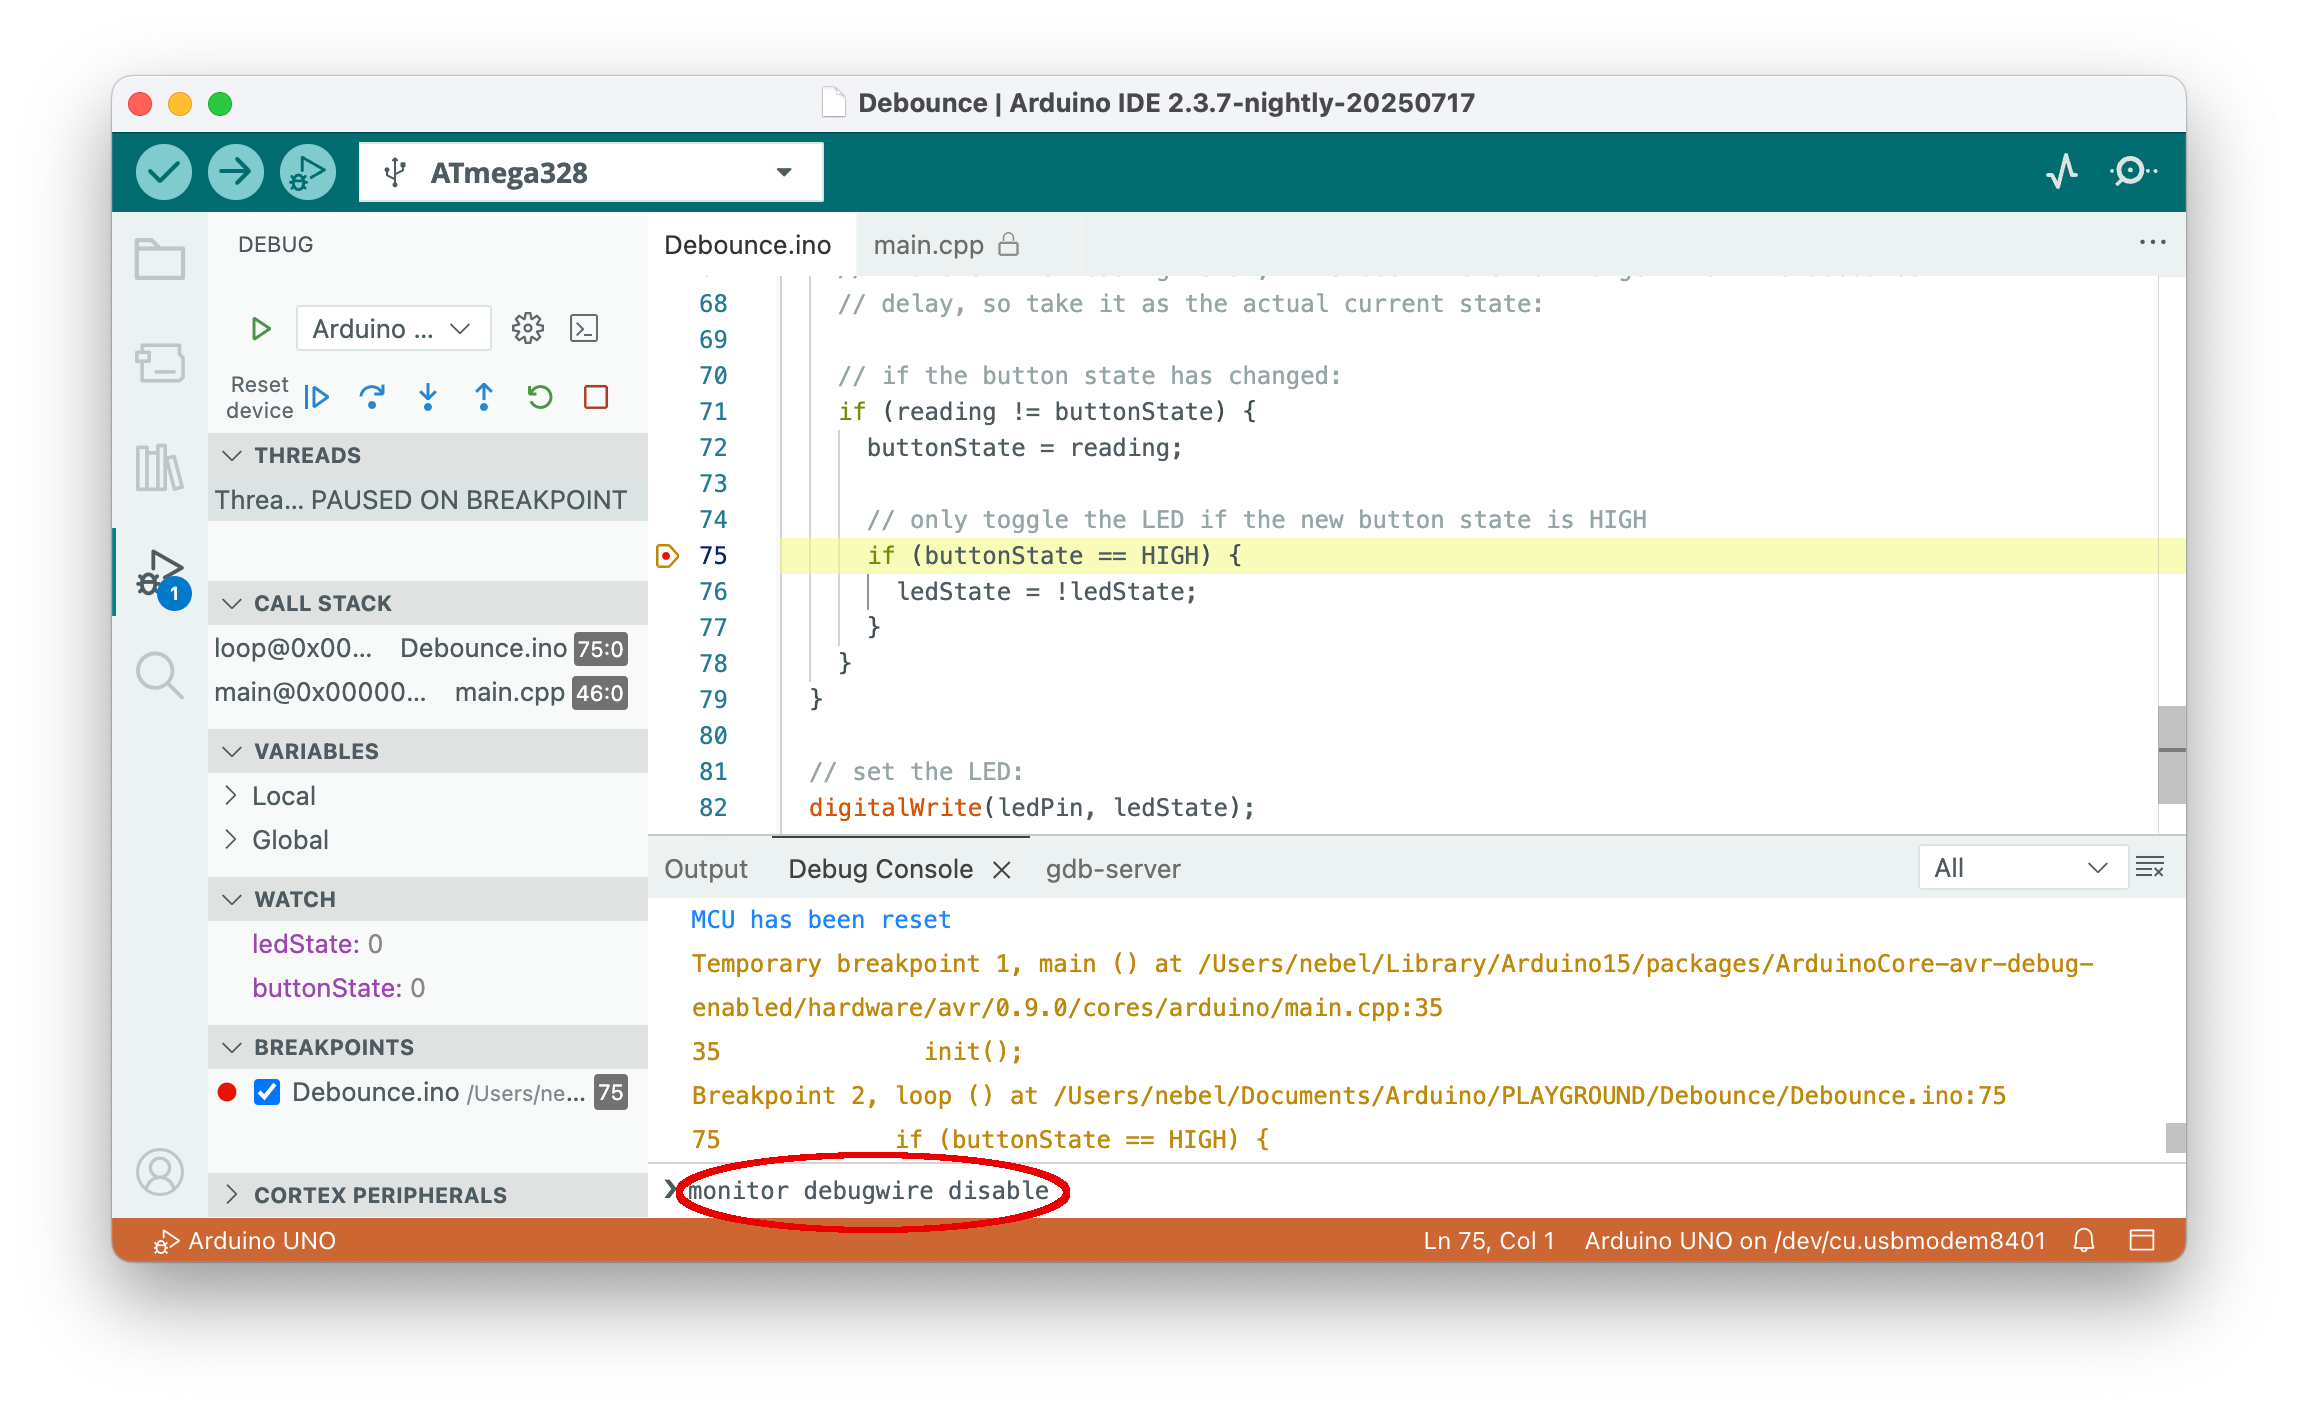
If you scroll down in the Debug Console, you will see that the command was successful. Now you can definitely leave the debugger.
It may also be a good idea to disable the Optimize for Debugging flag in the Sketch menu, because not doing so will result in larger flash code next time you compile a sketch.
If you want to restore your UNO to its original state, you also need to burn the bootloader again. If you want the original Optiboot bootloader, then you have to change the board to Arduino UNO, which we will assume. However, you also have the option to burn the urboot bootloader, which is now standard in MiniCore, which has a number of advantages over Optiboot.
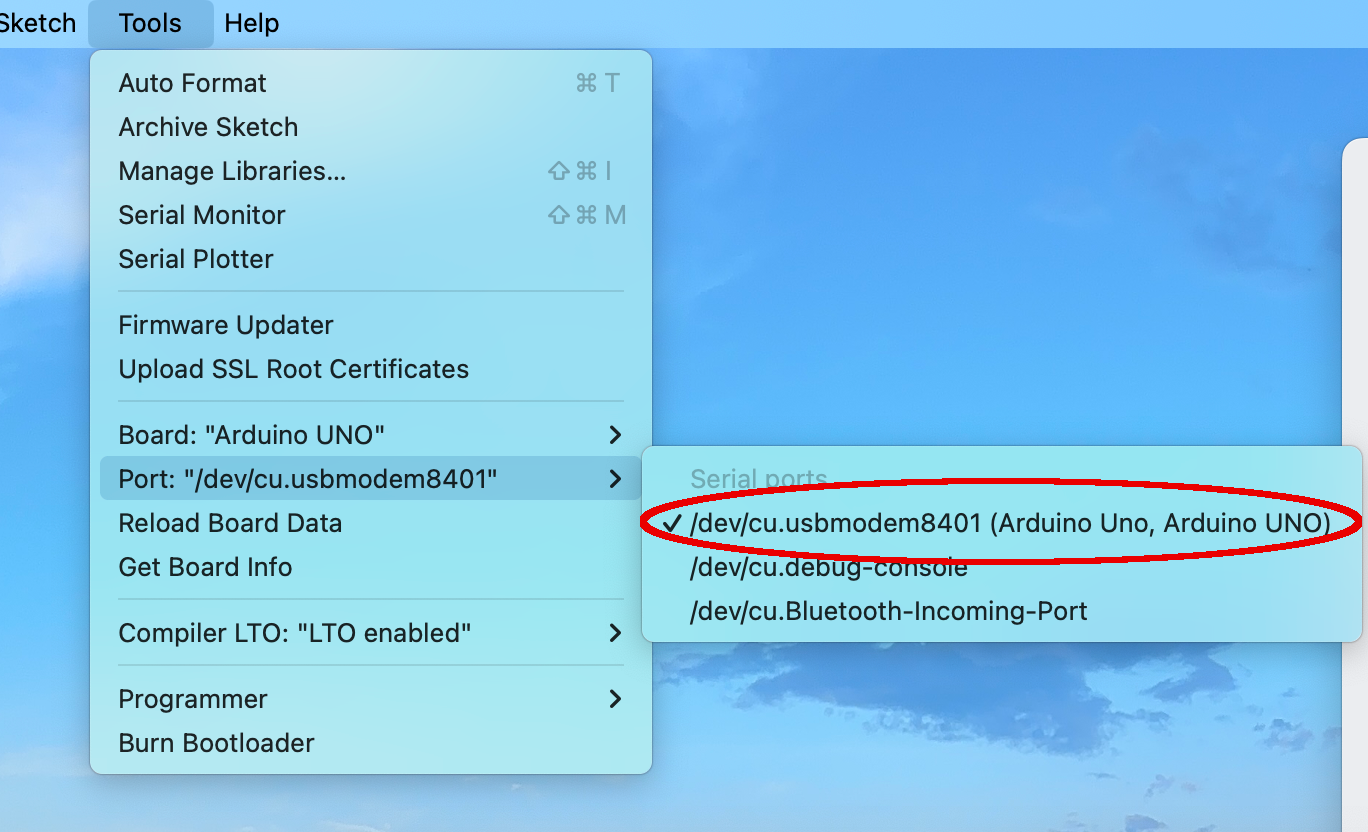
Regardless of your choice, select the serial line connected to dw-link.
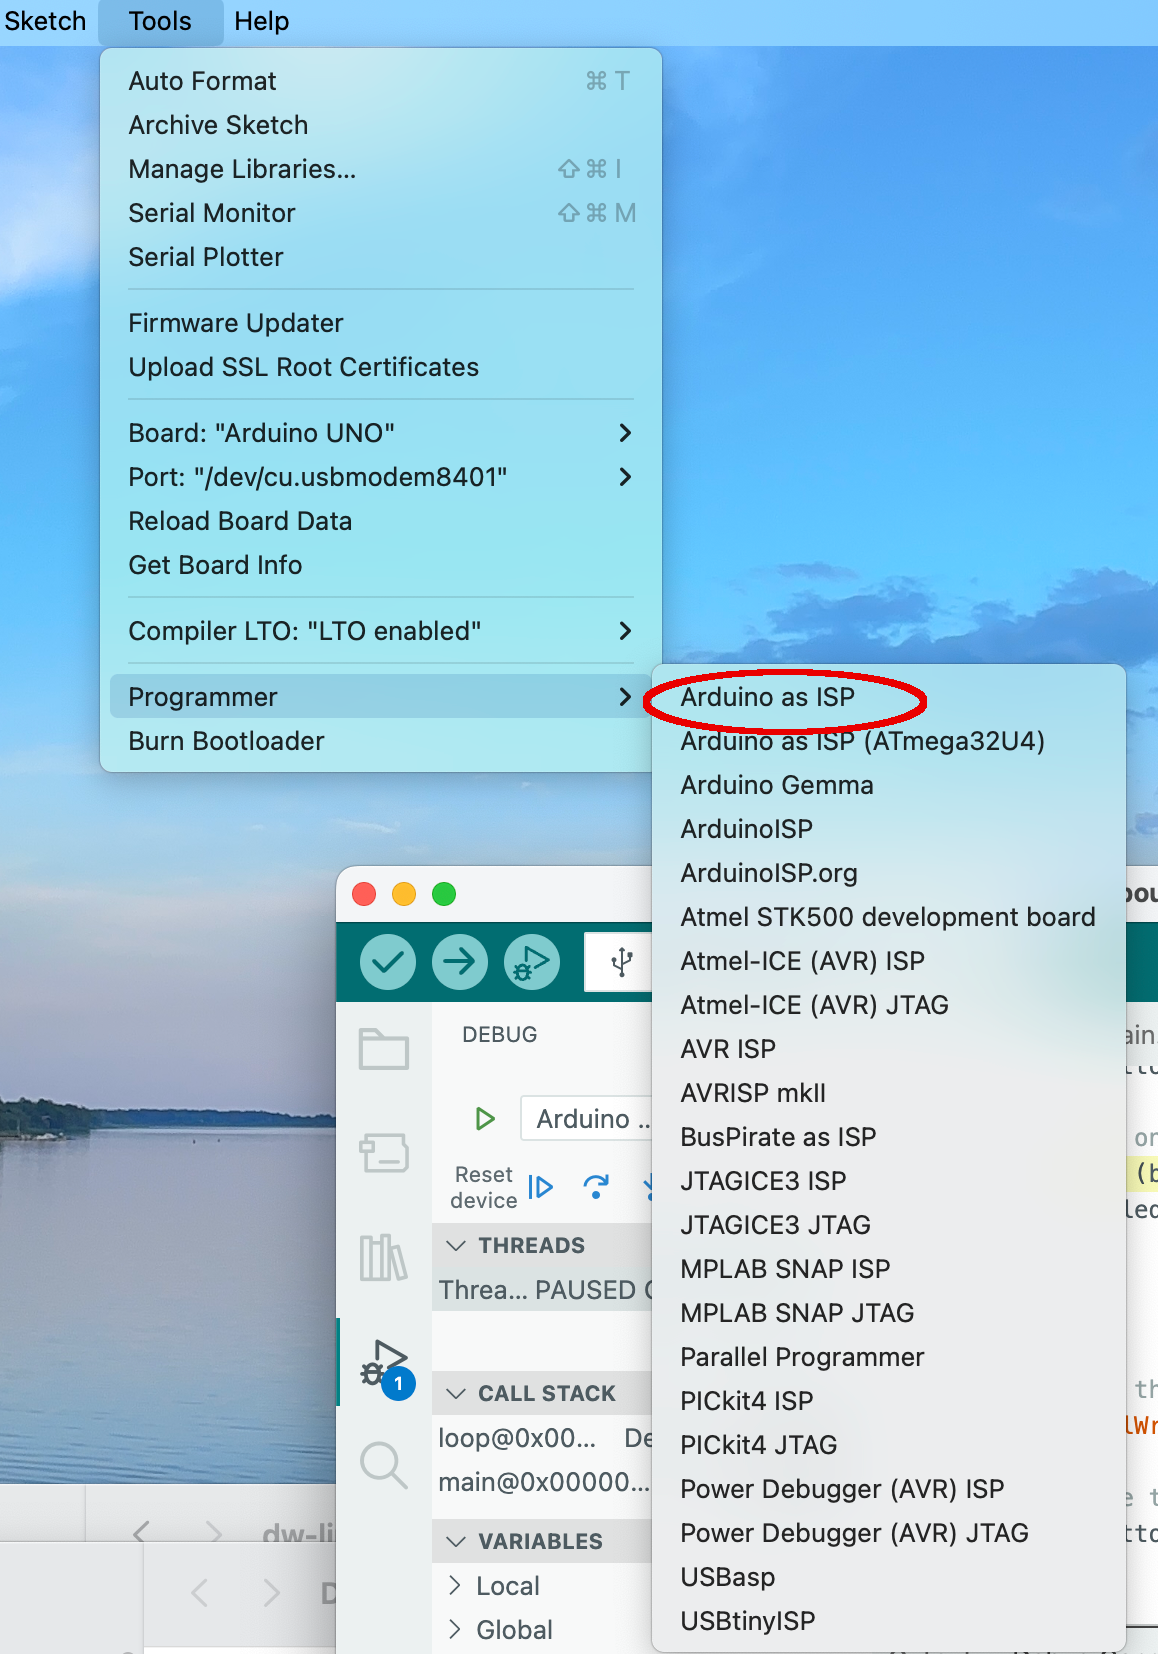
Select as the programmer Arduino as ISP.
Then select the Burn Bootloader entry in the tools menu.
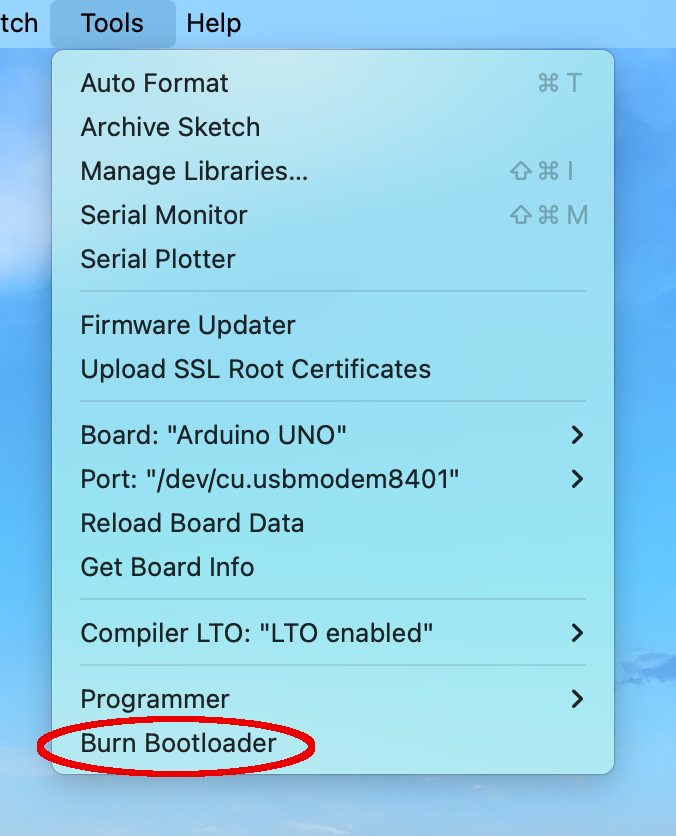
The debug probe, which now acts as a programmer, should then be able to handle the rest.
As a final measure, you may want to restore the solder bridge RESET EN or reinsert a removed capacitor. If possible, you can instead try to fit onto the board some pins that can be shortened with a jumper instead.
Potential problems
There is always the chance that something goes south, either debugging does not start at all, or something funny happens while debugging. If the status LED of dw-link starts to blink furiously, then the hardware debugger has hit an unrecoverable error. Typing monitor info into the input field of the GDB debugger can then help you find out about the error number, which is decoded in the Troubleshooting section.
It may also be a good idea to consult the Limitations section.