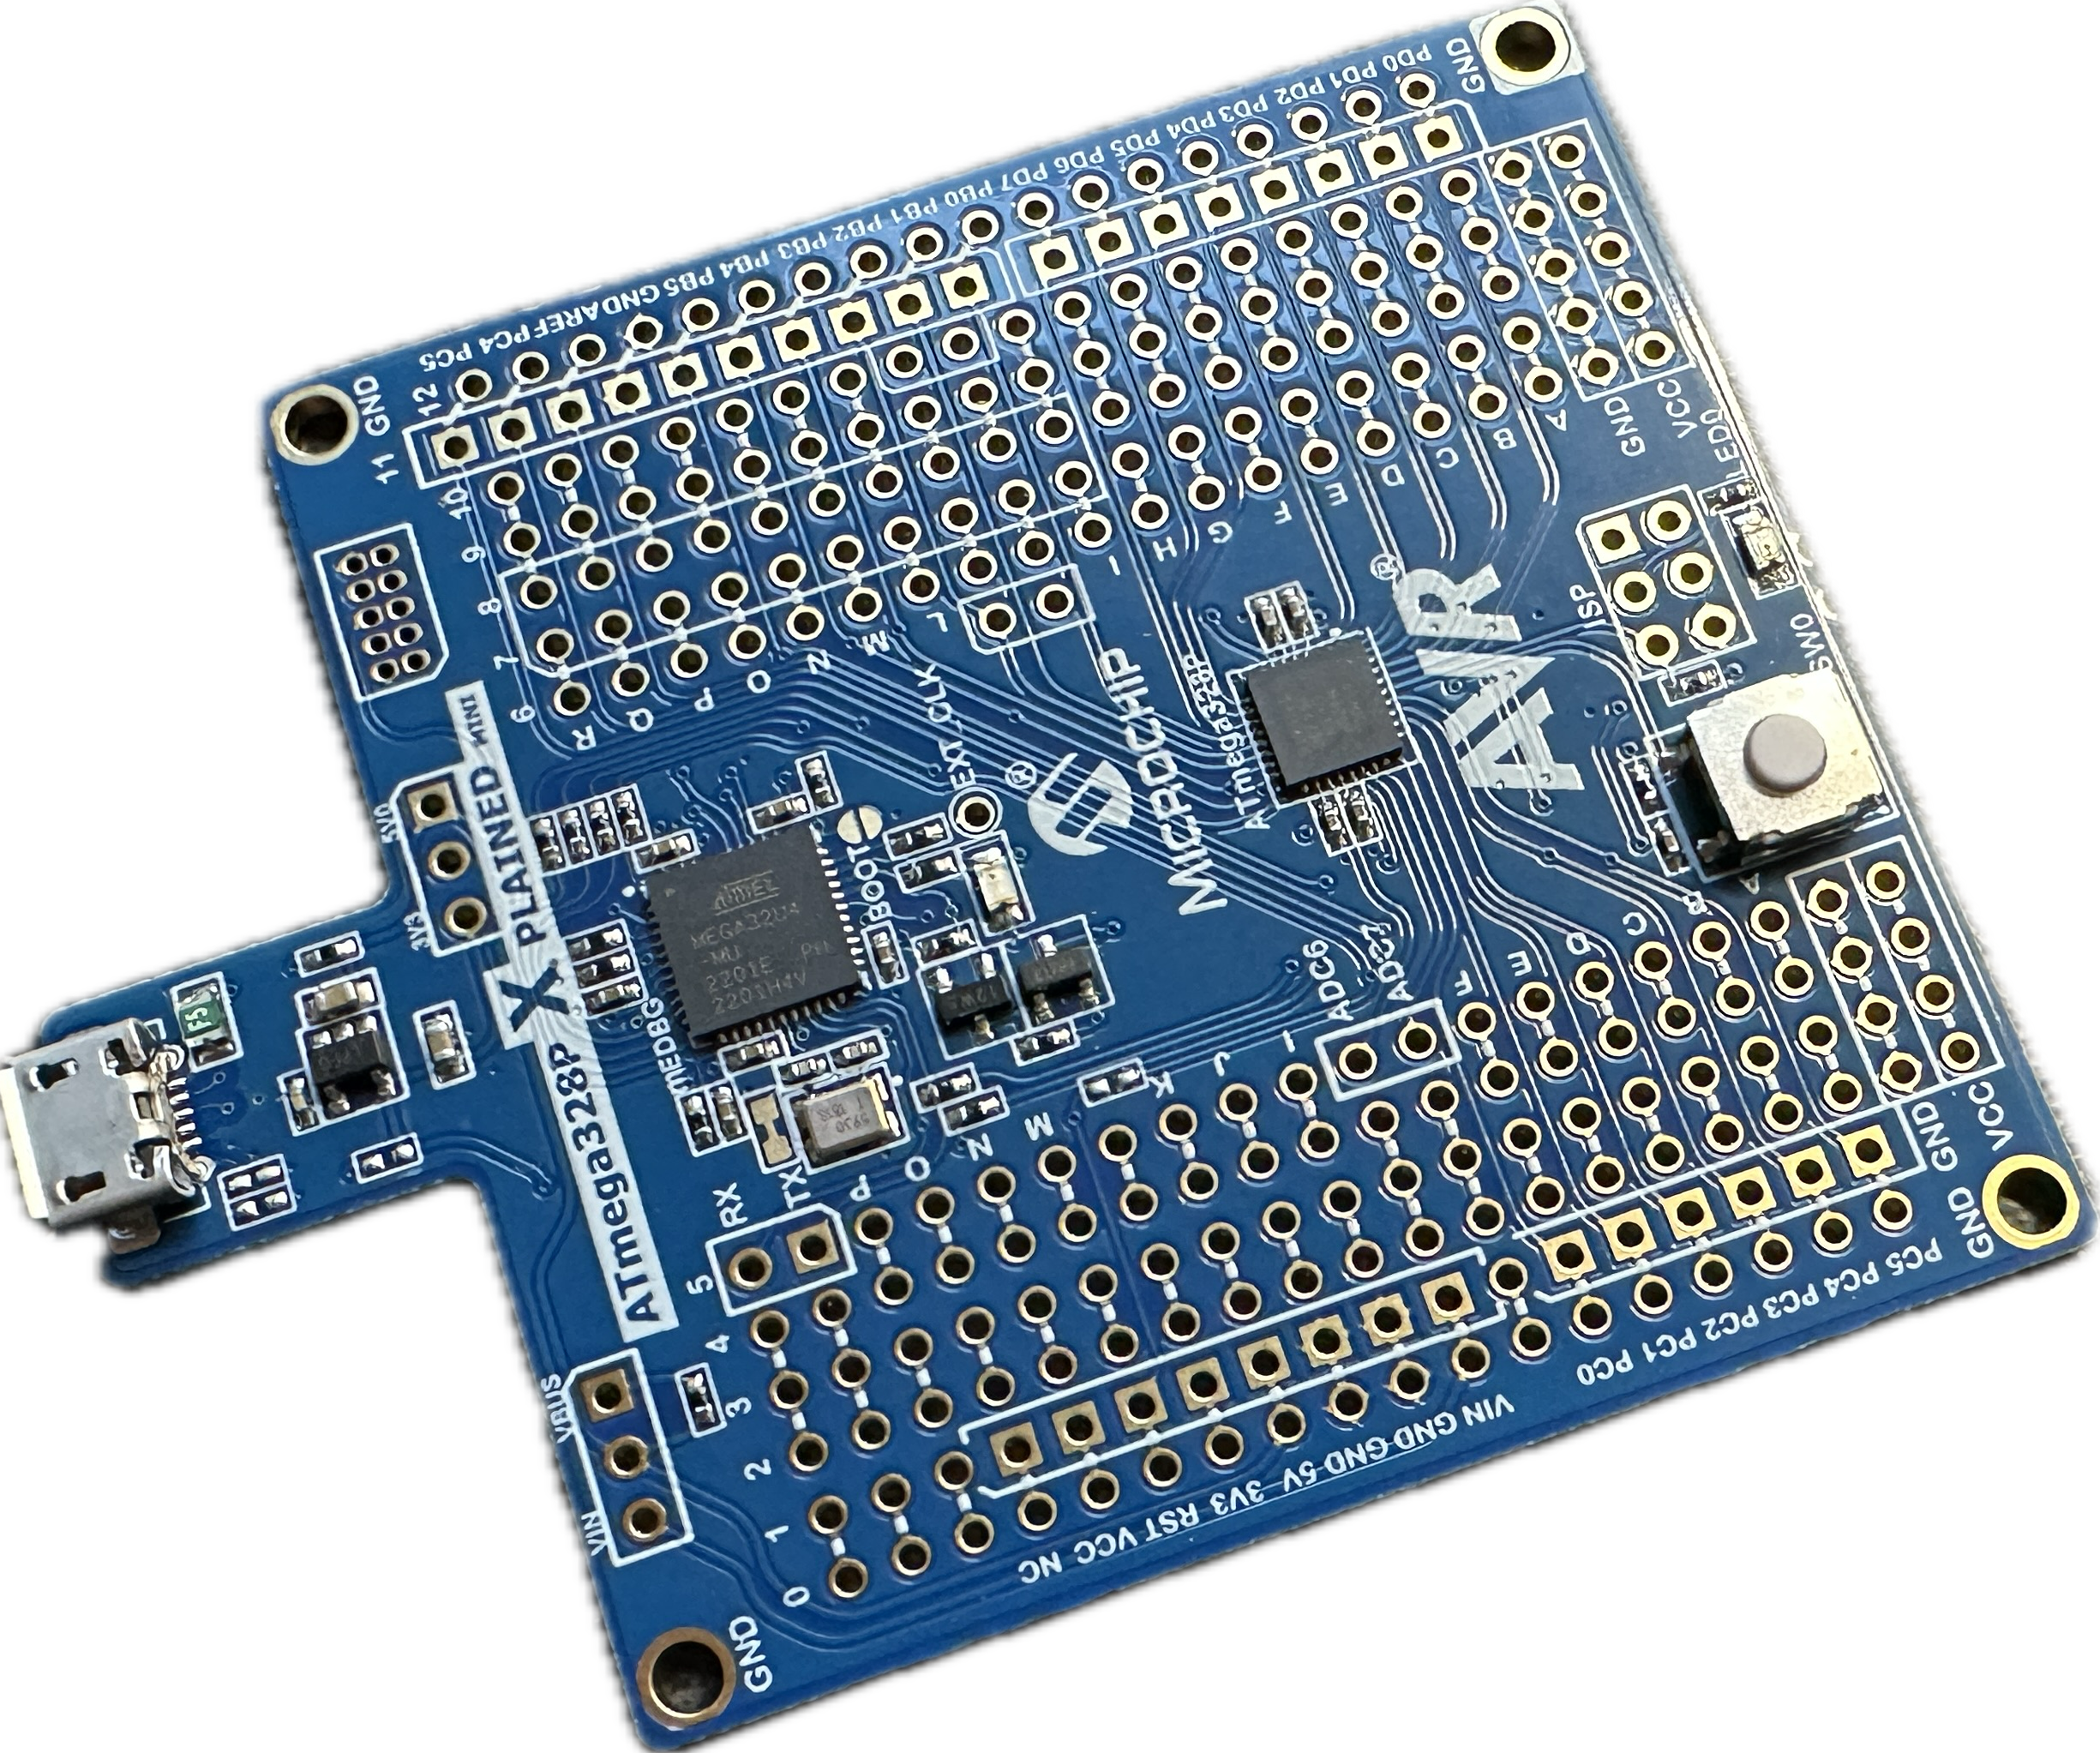
Quickstart guide: ATmega328P Xplained Mini
This quickstart guide explains how to set up the Arduino IDE 2 so that you can use its debugging feature on an Atmega328P Xplained Mini board. This development board is ideal for making a first experience with embedded debugging because it already contains an onboard debugger. This means you do not have to bother with preparing the board for debugging, connecting the debug probe to the board, choosing a programmer/debugger, and setting the proper fuses. It is simply plug-and-play.
In addition, this development board has an Arduino UNO R3 footprint. If you solder headers (at the right place) on the board, then it is possible to plug ordinary Uno shields into the headers. And if you need more I/O power, there is also an Xplained Mini board with the ATmega328PB for the same price. By the way, these boards are not overly expensive.
Step 1: Extend the list of boards manager URLs
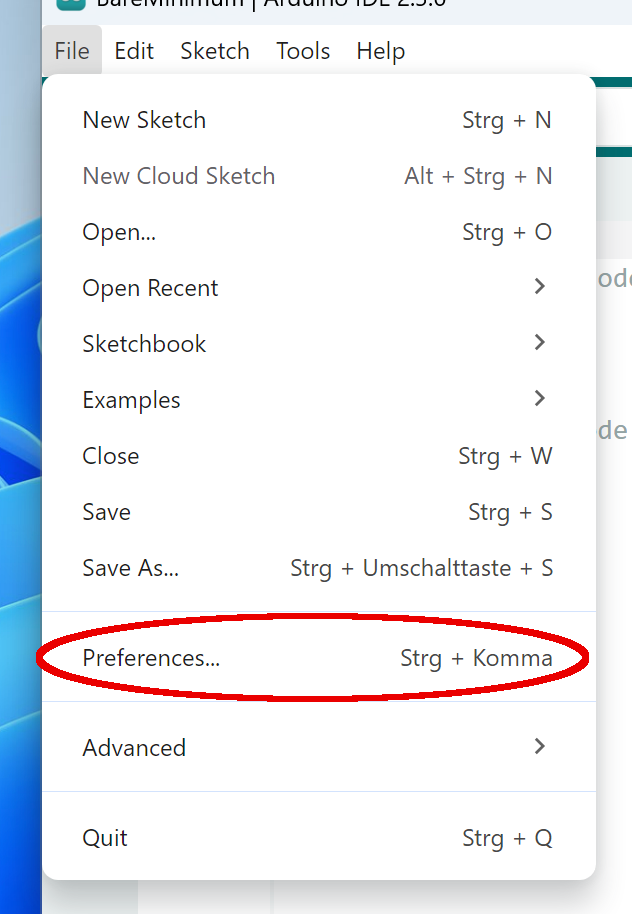
Assuming that you have already installed the Arduino IDE 2, you first have to extend the list of Additional boards manager URLs. Start the Preferences dialog, which you find, depending on your operating system, either in the Arduino IDE or the File menu.
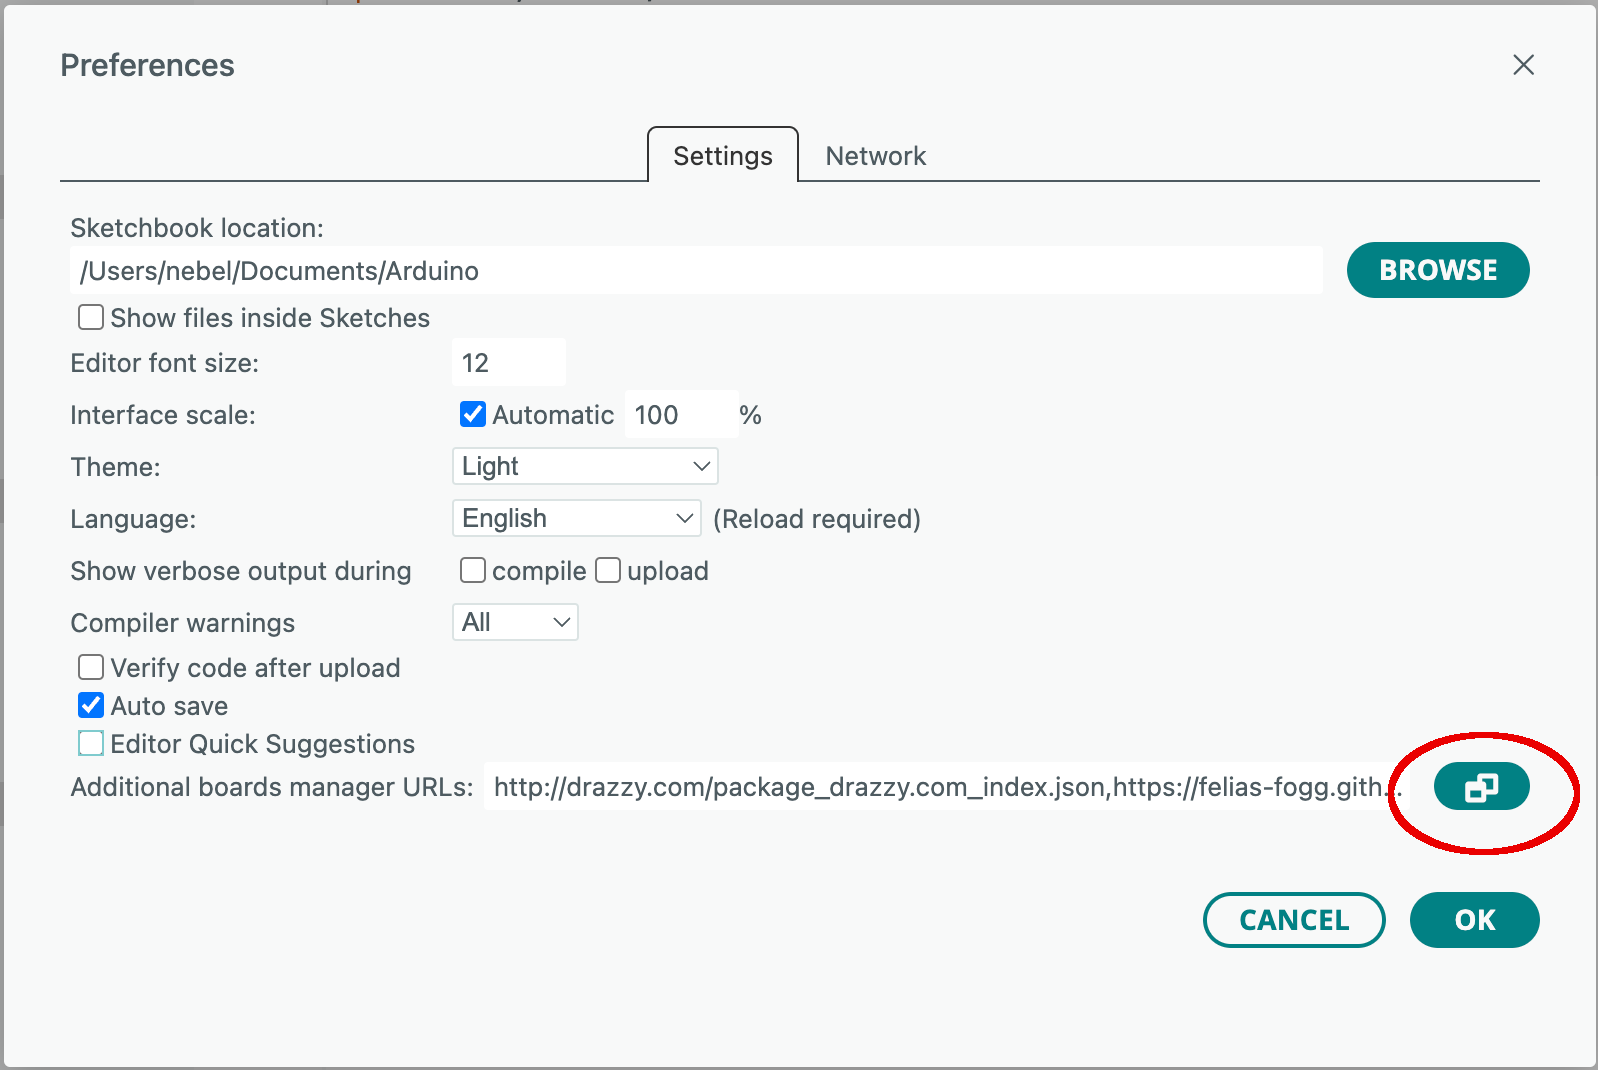
Now select the field with the additional board manager URLs.
Type the following URL into a new line:
https://downloads.pyavrocd.io/package_debug_enabled_index.json
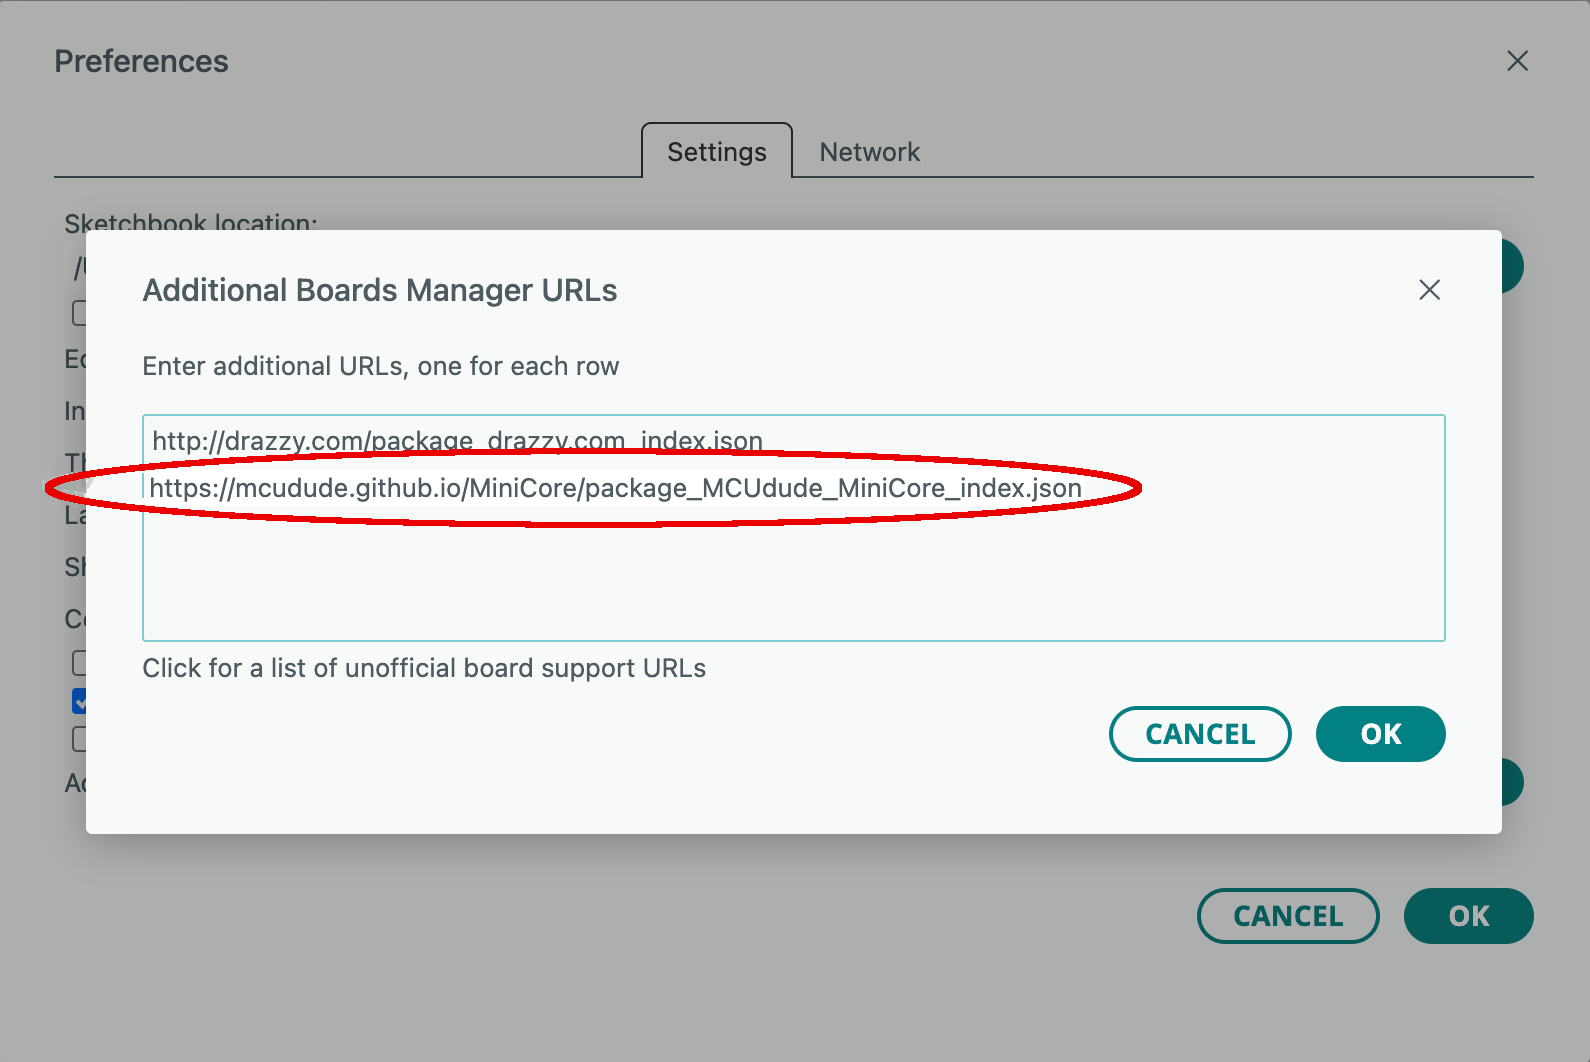
You close the dialog by clicking on two OK buttons in succession.
Step 2: Install a debug-enabled core
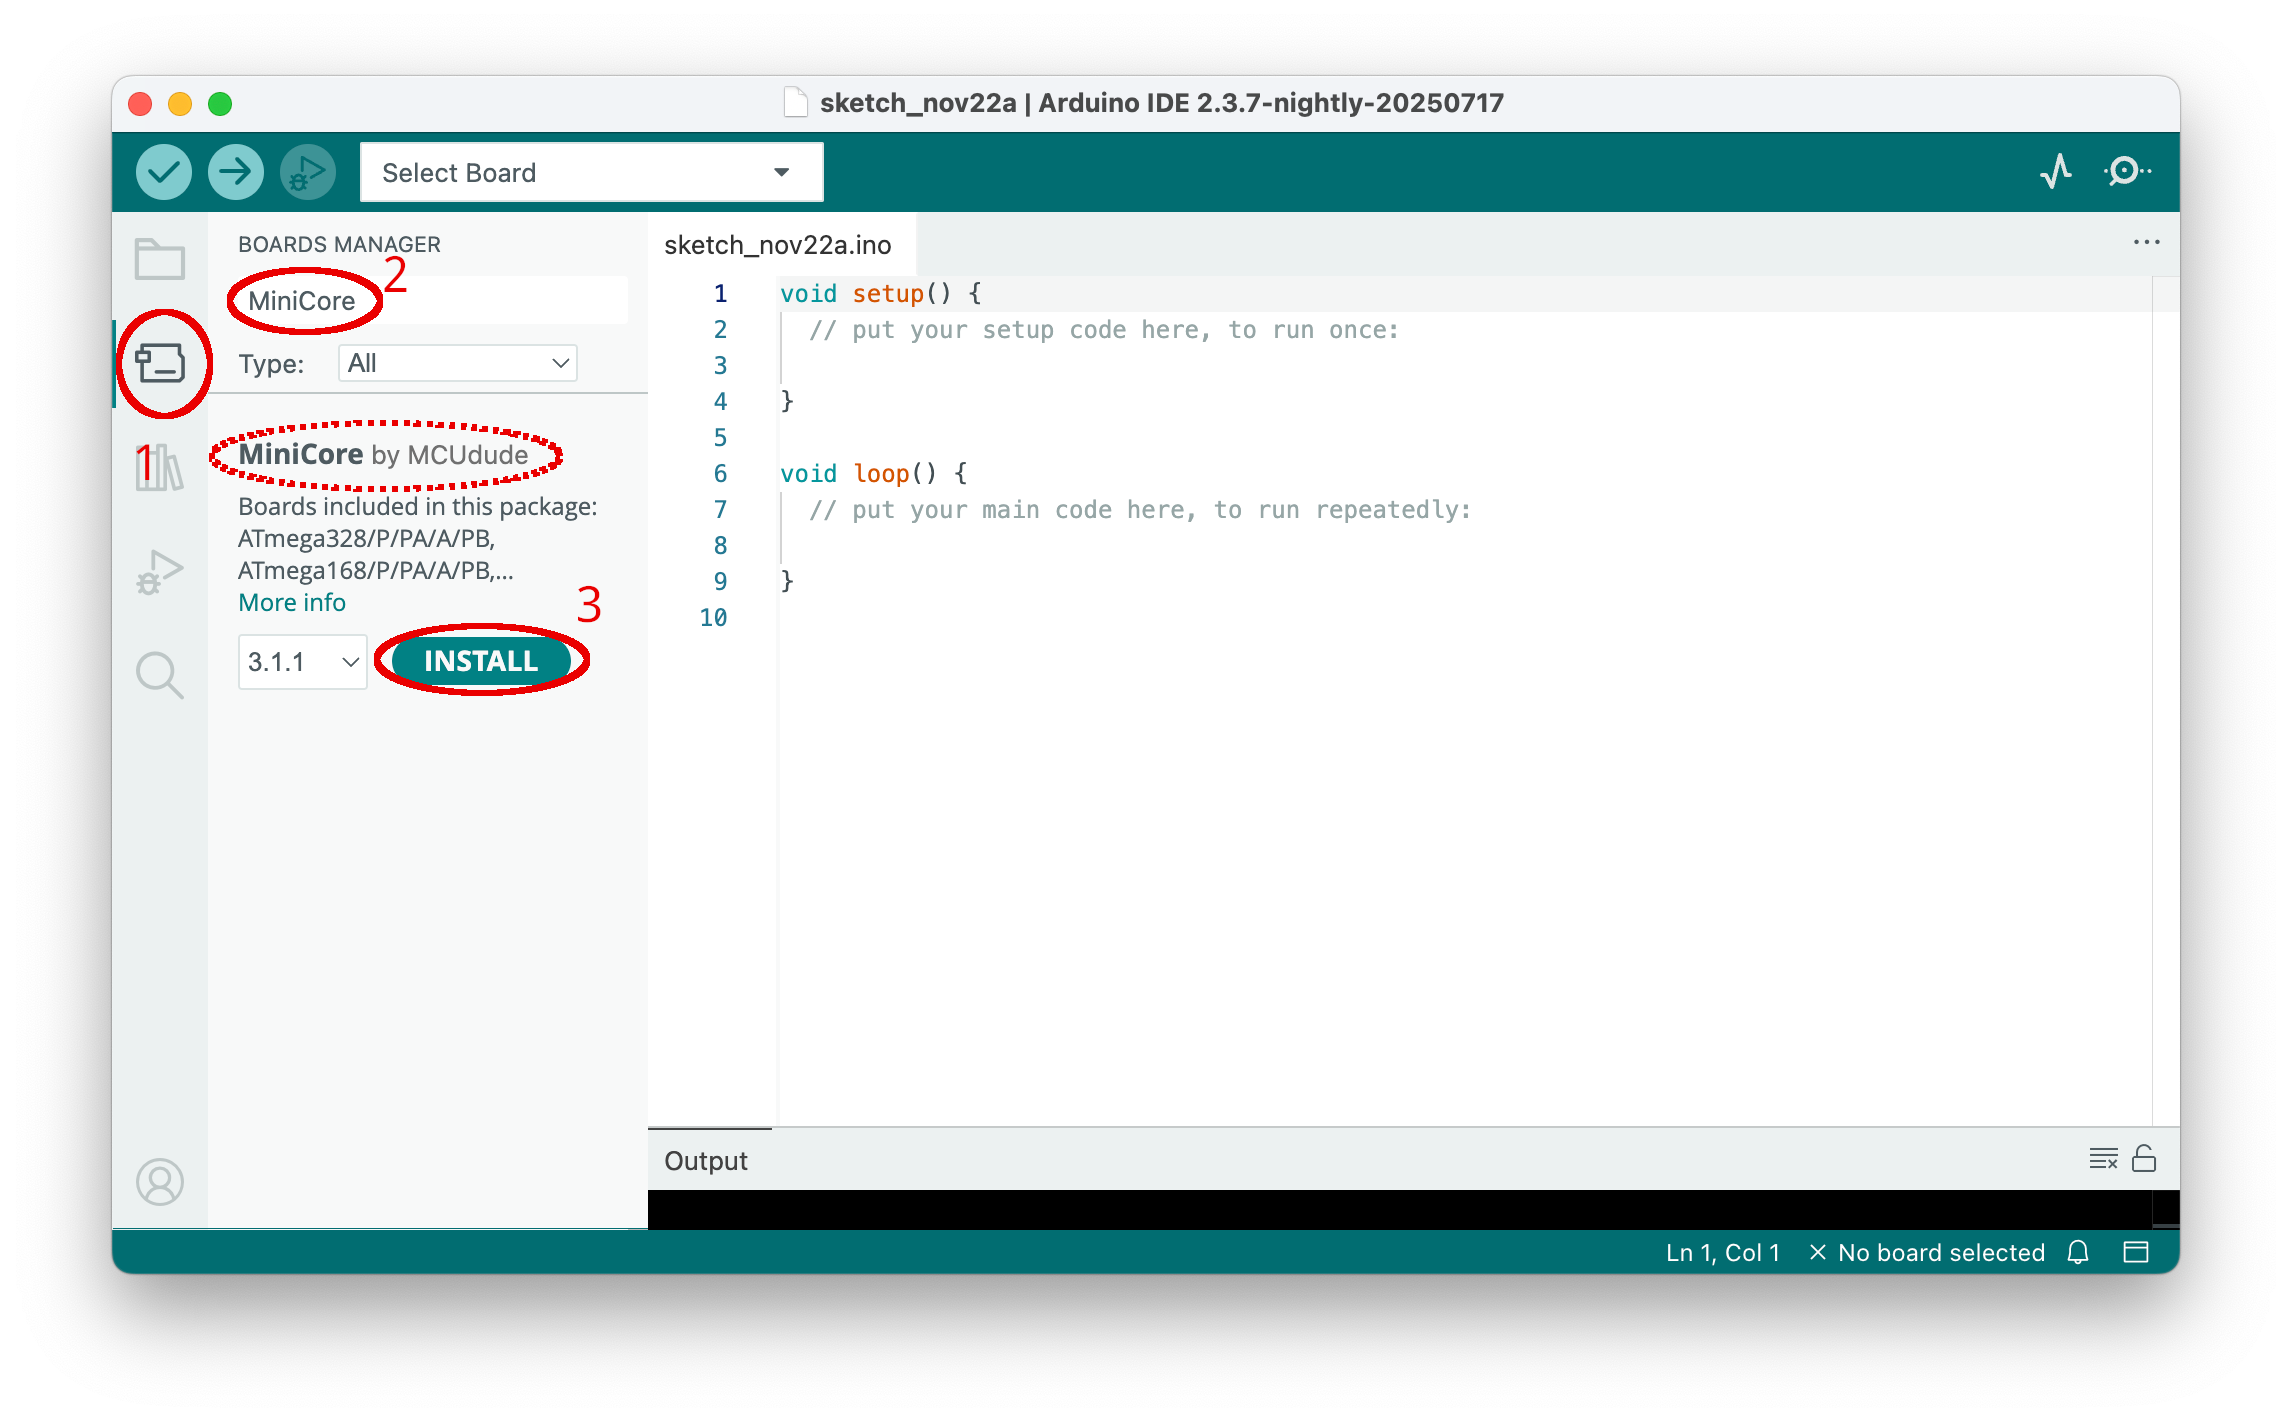
Now you need to activate the boards manager by clicking on the board symbol in the left side bar (1). After the boards manager pane has been opened, type "Debug" into the search line (2). After that, all cores with the word "Debug" in their description are displayed. Scroll down until you see one with the title "Atmel AVR Xplained-minis (Debug enabled)." Install this core by clicking on Install (3).
Loading the core and all the necessary tools might take a while.
Linux systems
After the installation, users of Linux systems will need to add udev rules, which can be done manually. Alternatively, when the IDE does not find a debug probe, it will tell you what to do in order to install the rules using pyavrocd.
Step 3: Connect the board and select the board type and port in the boards manager
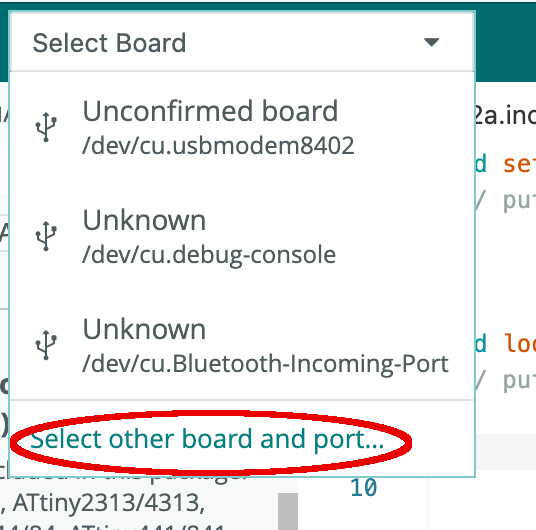
In our case, connecting the target board to the host consists simply of plugging the USB cable into the board. After that, you have to select the right board and serial line in the IDE. First, click on Select Board in the top bar and choose Select other board and port ....
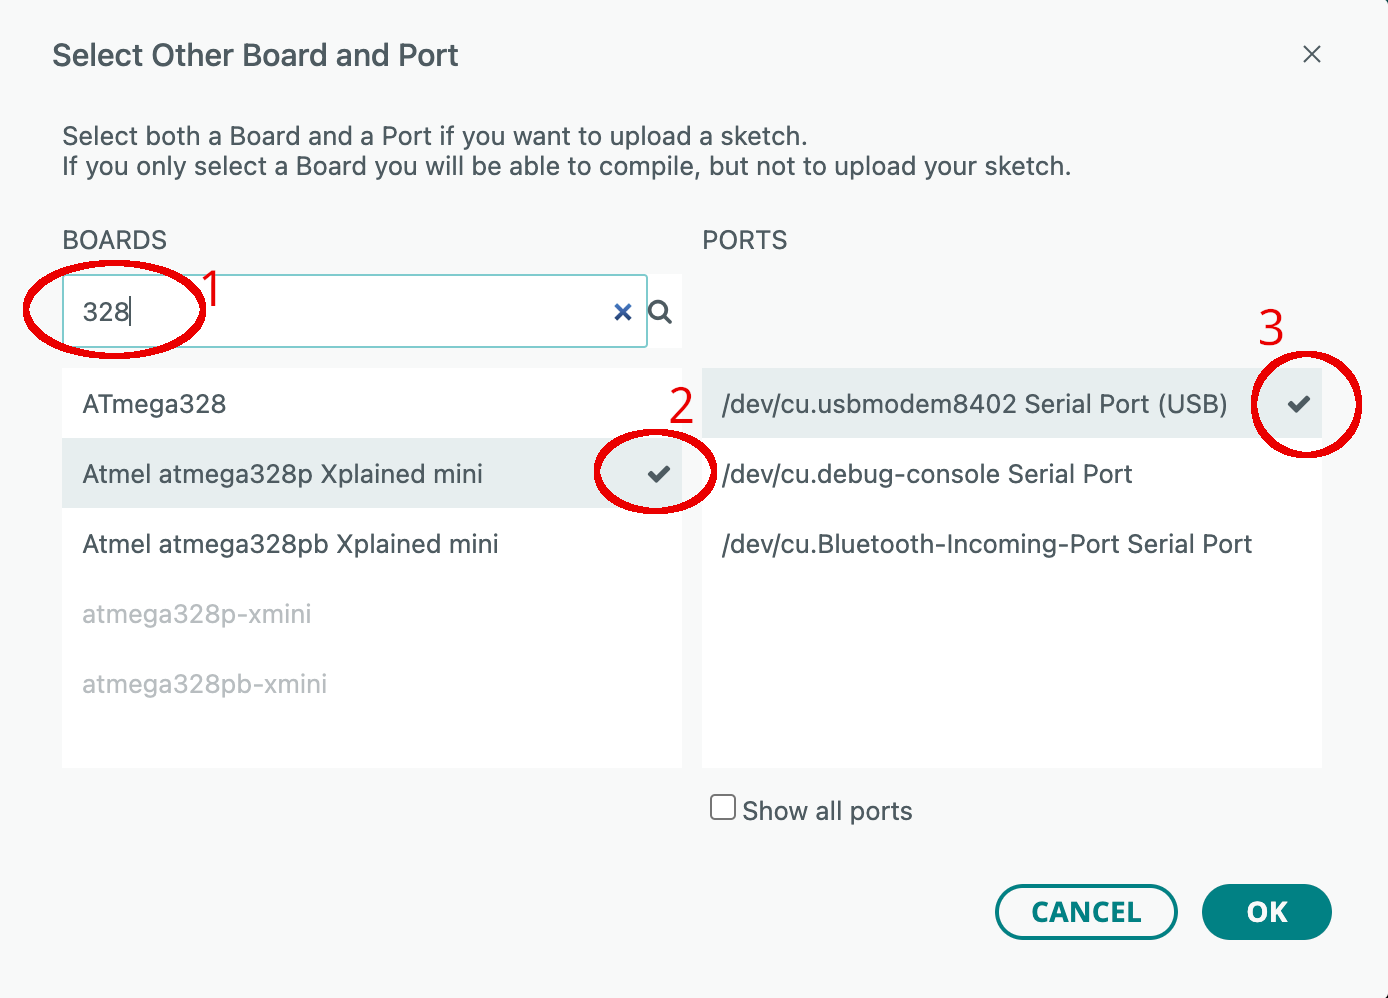
Then type "328" in the search field (1), select the right board (2), the correct port (3), and finally click the OK button.
The debugging icon in the top row is no longer greyed out. In other words, you have unleashed the power of the Arduino debugger at this point.
Step 4: Edit and compile a sketch
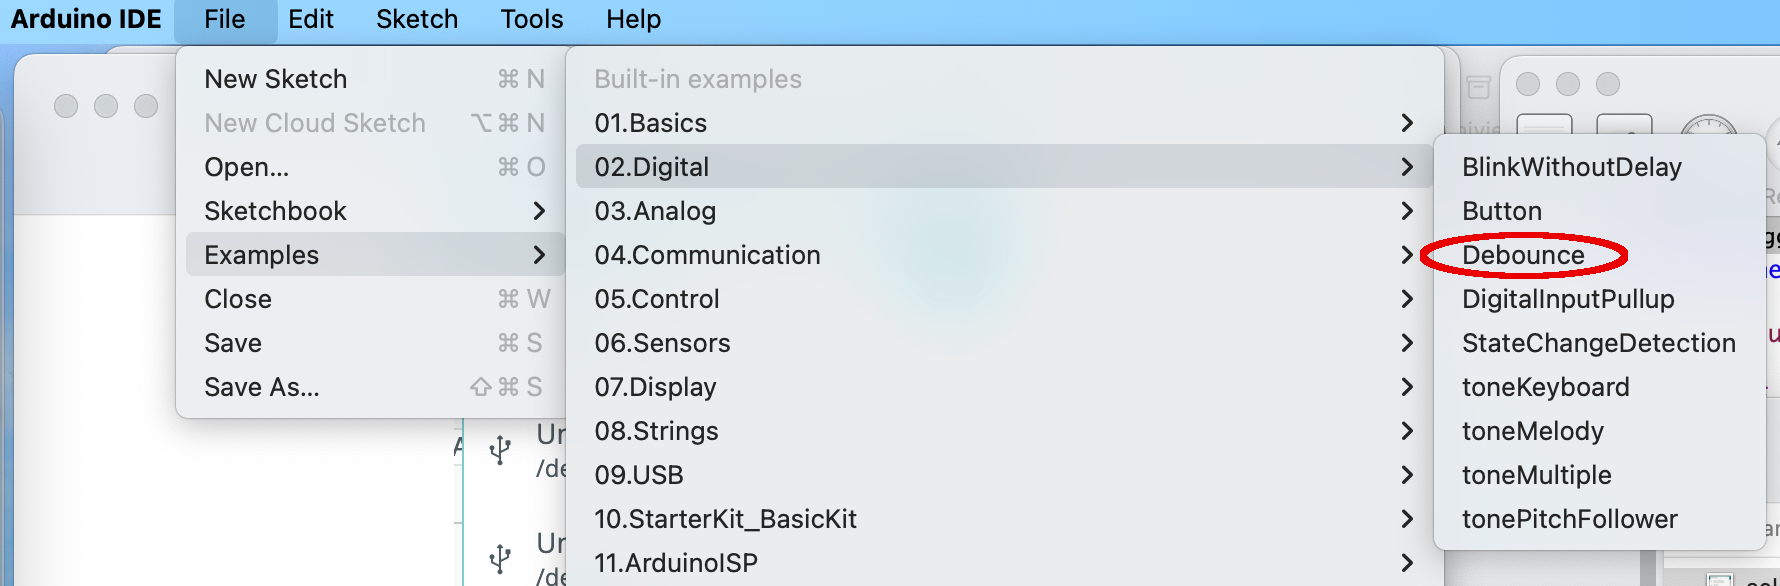
Let us choose a simple sketch that is a little bit more challenging than the Blink example. The Debounce example will do. Let us load it and modify it for our needs.
This sketch will toggle the LED state (on pin 13) when a button is pressed. The program logic contains a basic form of debouncing so that noise induced by the button contact opening and closing is ignored. The button in this sketch is supposed to be at digital input line 2. The xmini, however, has such a button at digital input line 21. For this reason, we have to change line 31 of the sketch as follows:
const int buttonPin = 21; // the number of the pushbutton pin
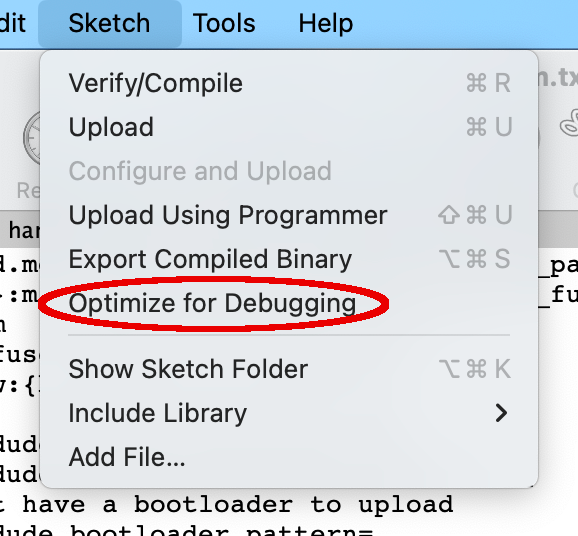
Before compiling and uploading the sketch, you should set the Optimize for Debugging flag in the Sketch menu. This flag will make sure that the produced machine code resembles the program flow in the source code in order to make debugging easier.
Now it is time to compile the sketch. Click the Verify button (a check mark symbol) in the top bar, which will compile the sketch. Loading the compiled code will then be done when the debugger is started. Instead, you can click on the Upload button (the right arrow symbol), which will compile and upload the code. In the case of the Xmini development board, this is the preferred way because it results in an overall faster upload time.
Step 5: Debug the sketch
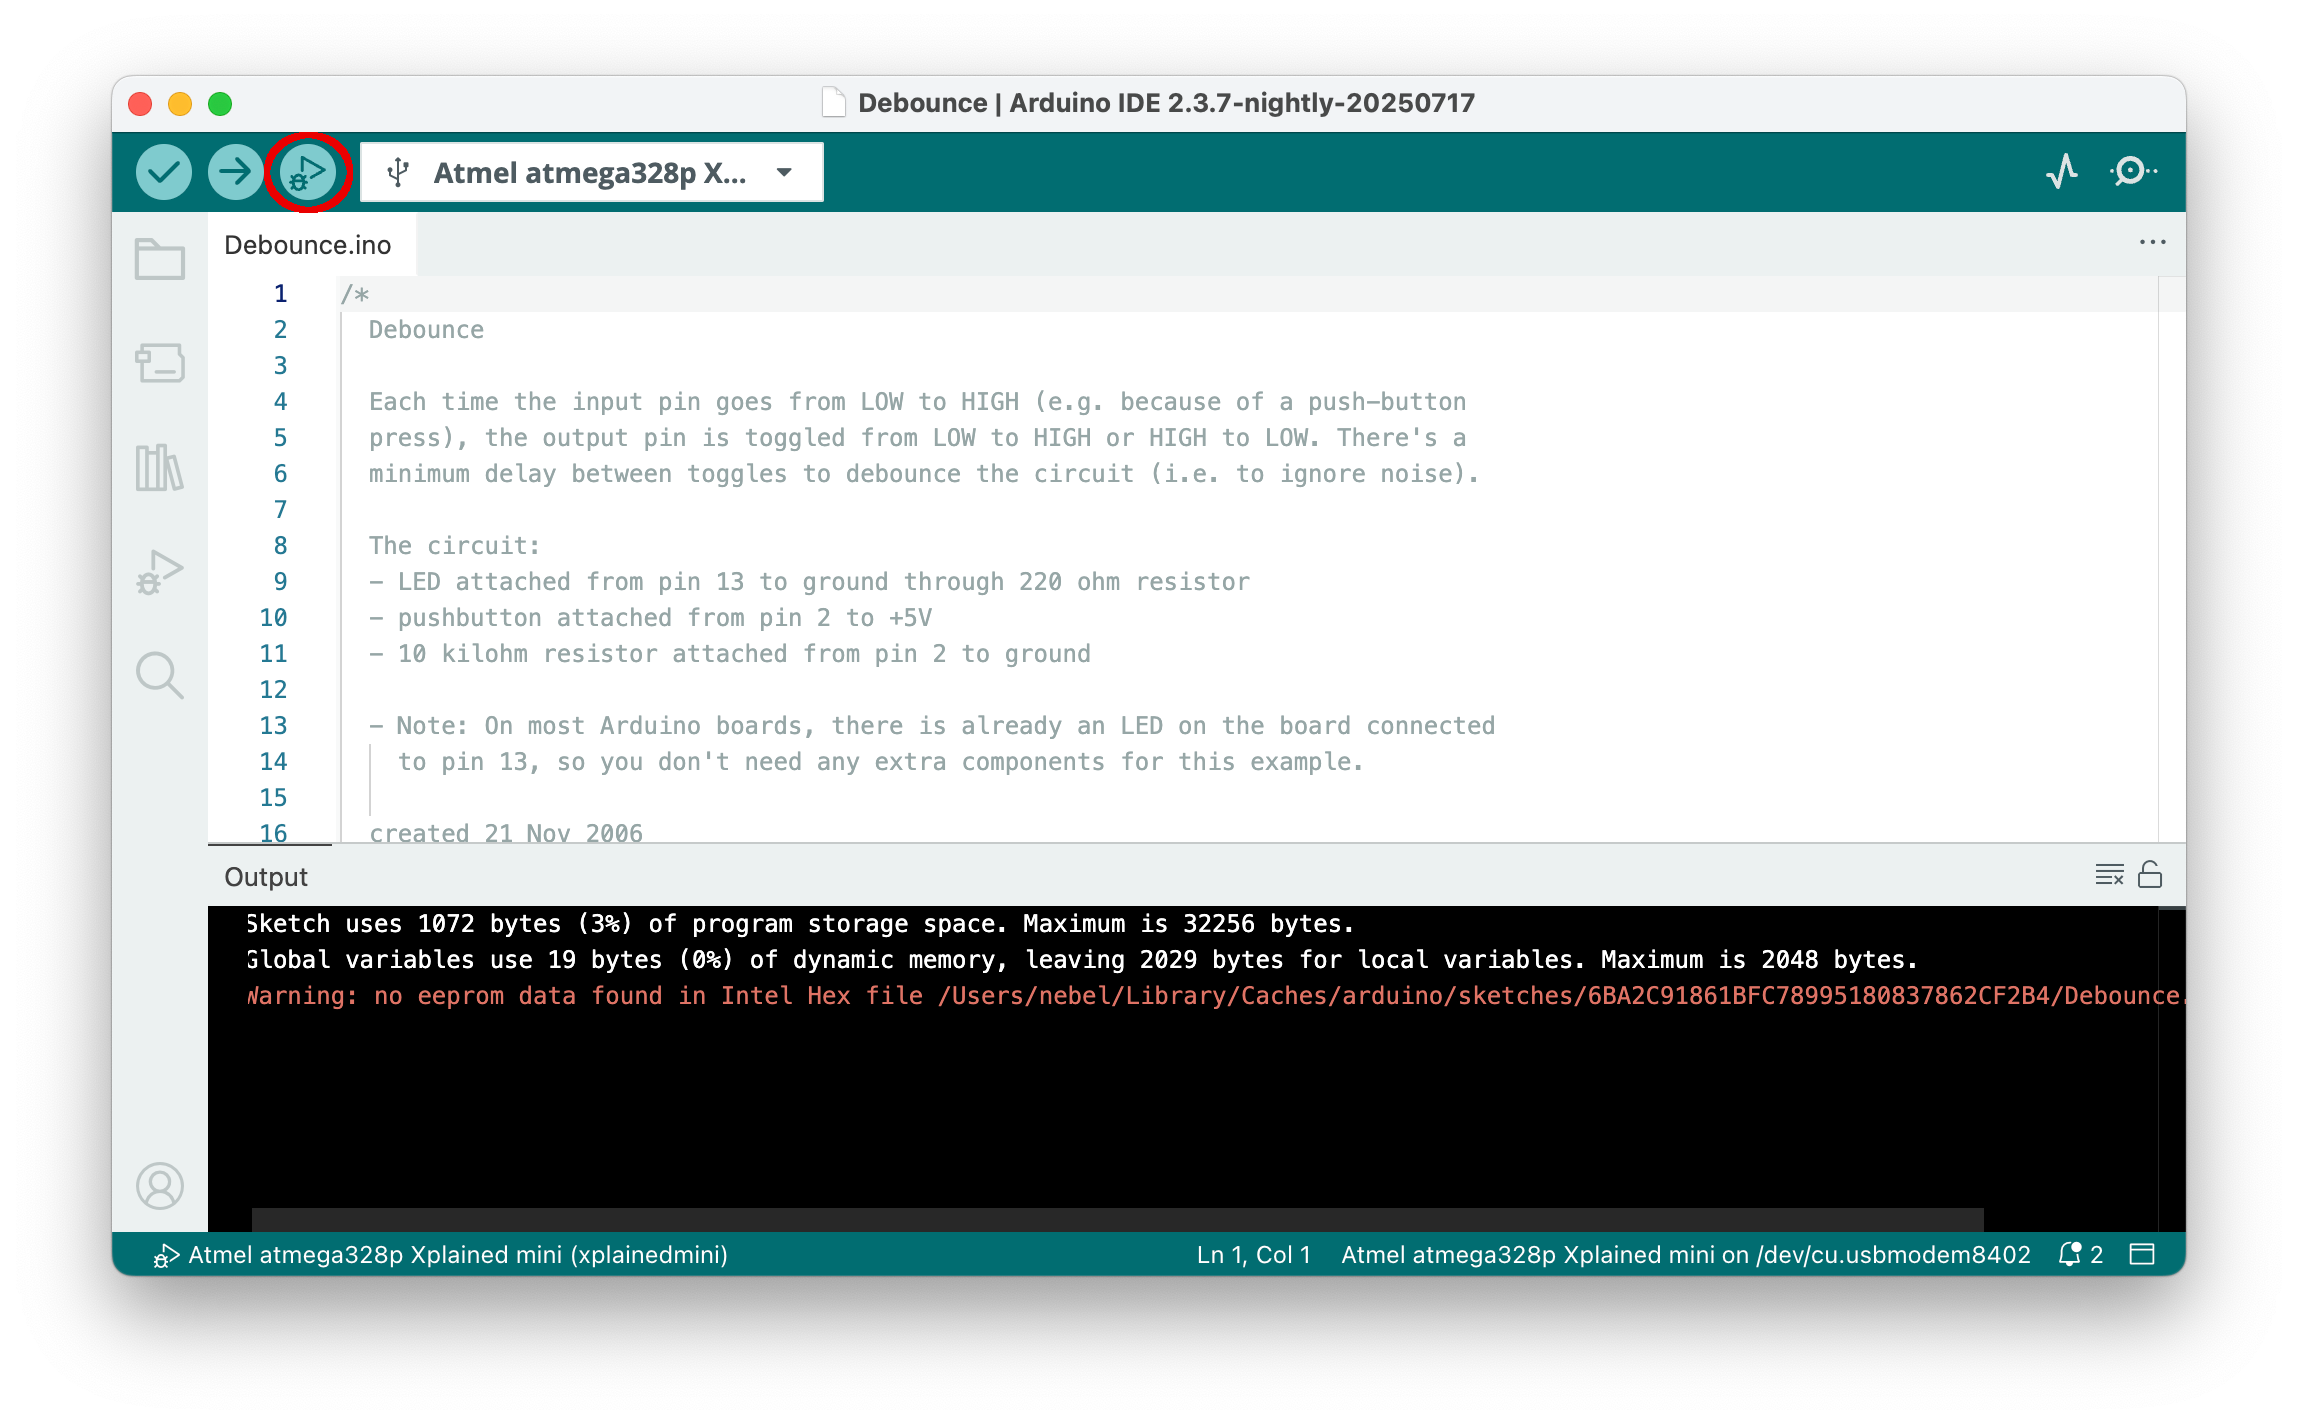
Now it is time to start debugging by clicking the Debug button (bug in front of a triangle) in the top row.
This will trigger a lot of actions. First, the debug pane to the left of the sketch editor pane will be opened. Second, below the sketch editor pane, first a gdb-server console will appear, then the Debug Console. While this is happening, the sketch is loaded and execution is started.
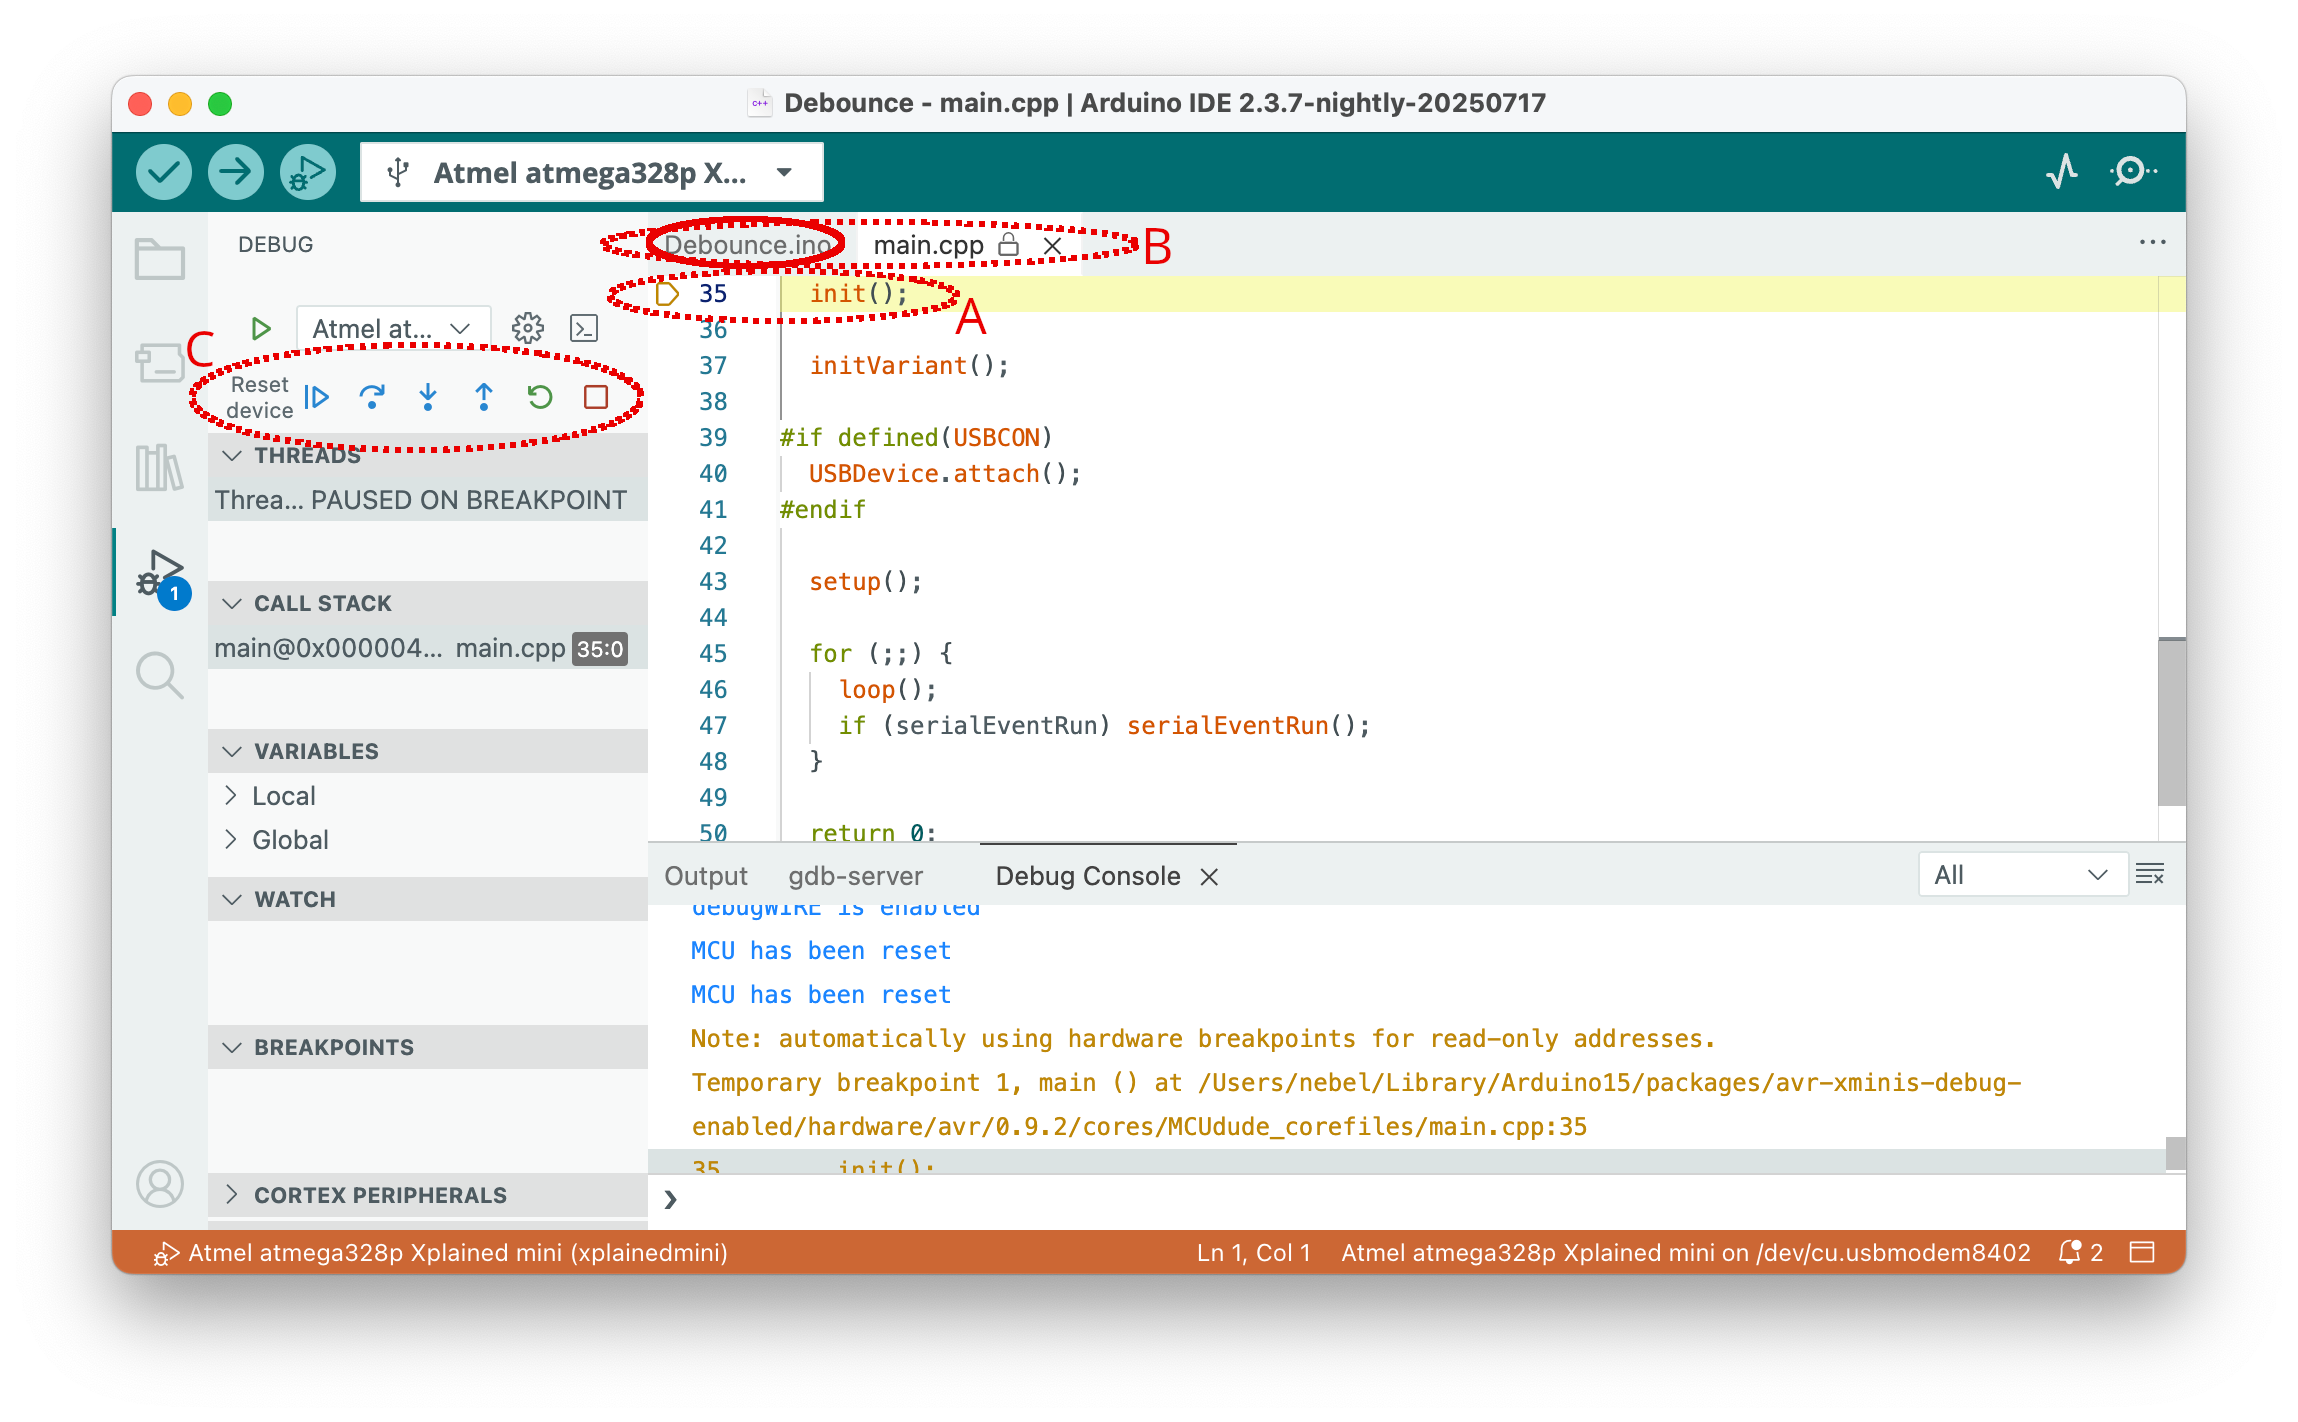
The execution will always stop in the first line of the main function in main.cpp, which is an Arduino internal function. The line where execution has been stopped is marked yellow (perhaps with an additional yellow triangle) (A). Since this line is in a file different from the main sketch, it is loaded into the editor, and the loaded files are all shown in the top bar of the editor (B). The central debugging control is located in the debugging pane at the top (C). The buttons have the following meanings, from left to right:
- Resetting the device
- Continue execution or pause
- Step over: execute one source line
- Step into: execute stepping into the function, if in this line one is called
- Step out: finish the current function and stop after the line where it was called
- Restart: Same as Reset
- Stop: Terminate debugging
Pressing the Continue button in the situation depicted in the picture above would start execution. However, before we do this, let us set a breakpoint. For this purpose, we first select the original sketch file Debounce.ino at the top row of the editor pane.
This will bring up the sketch file. Scroll down to line 75 and set a breakpoint by clicking to the left of the line number (1). A red dot will mark the breakpoint. Now press the Continue button (2).
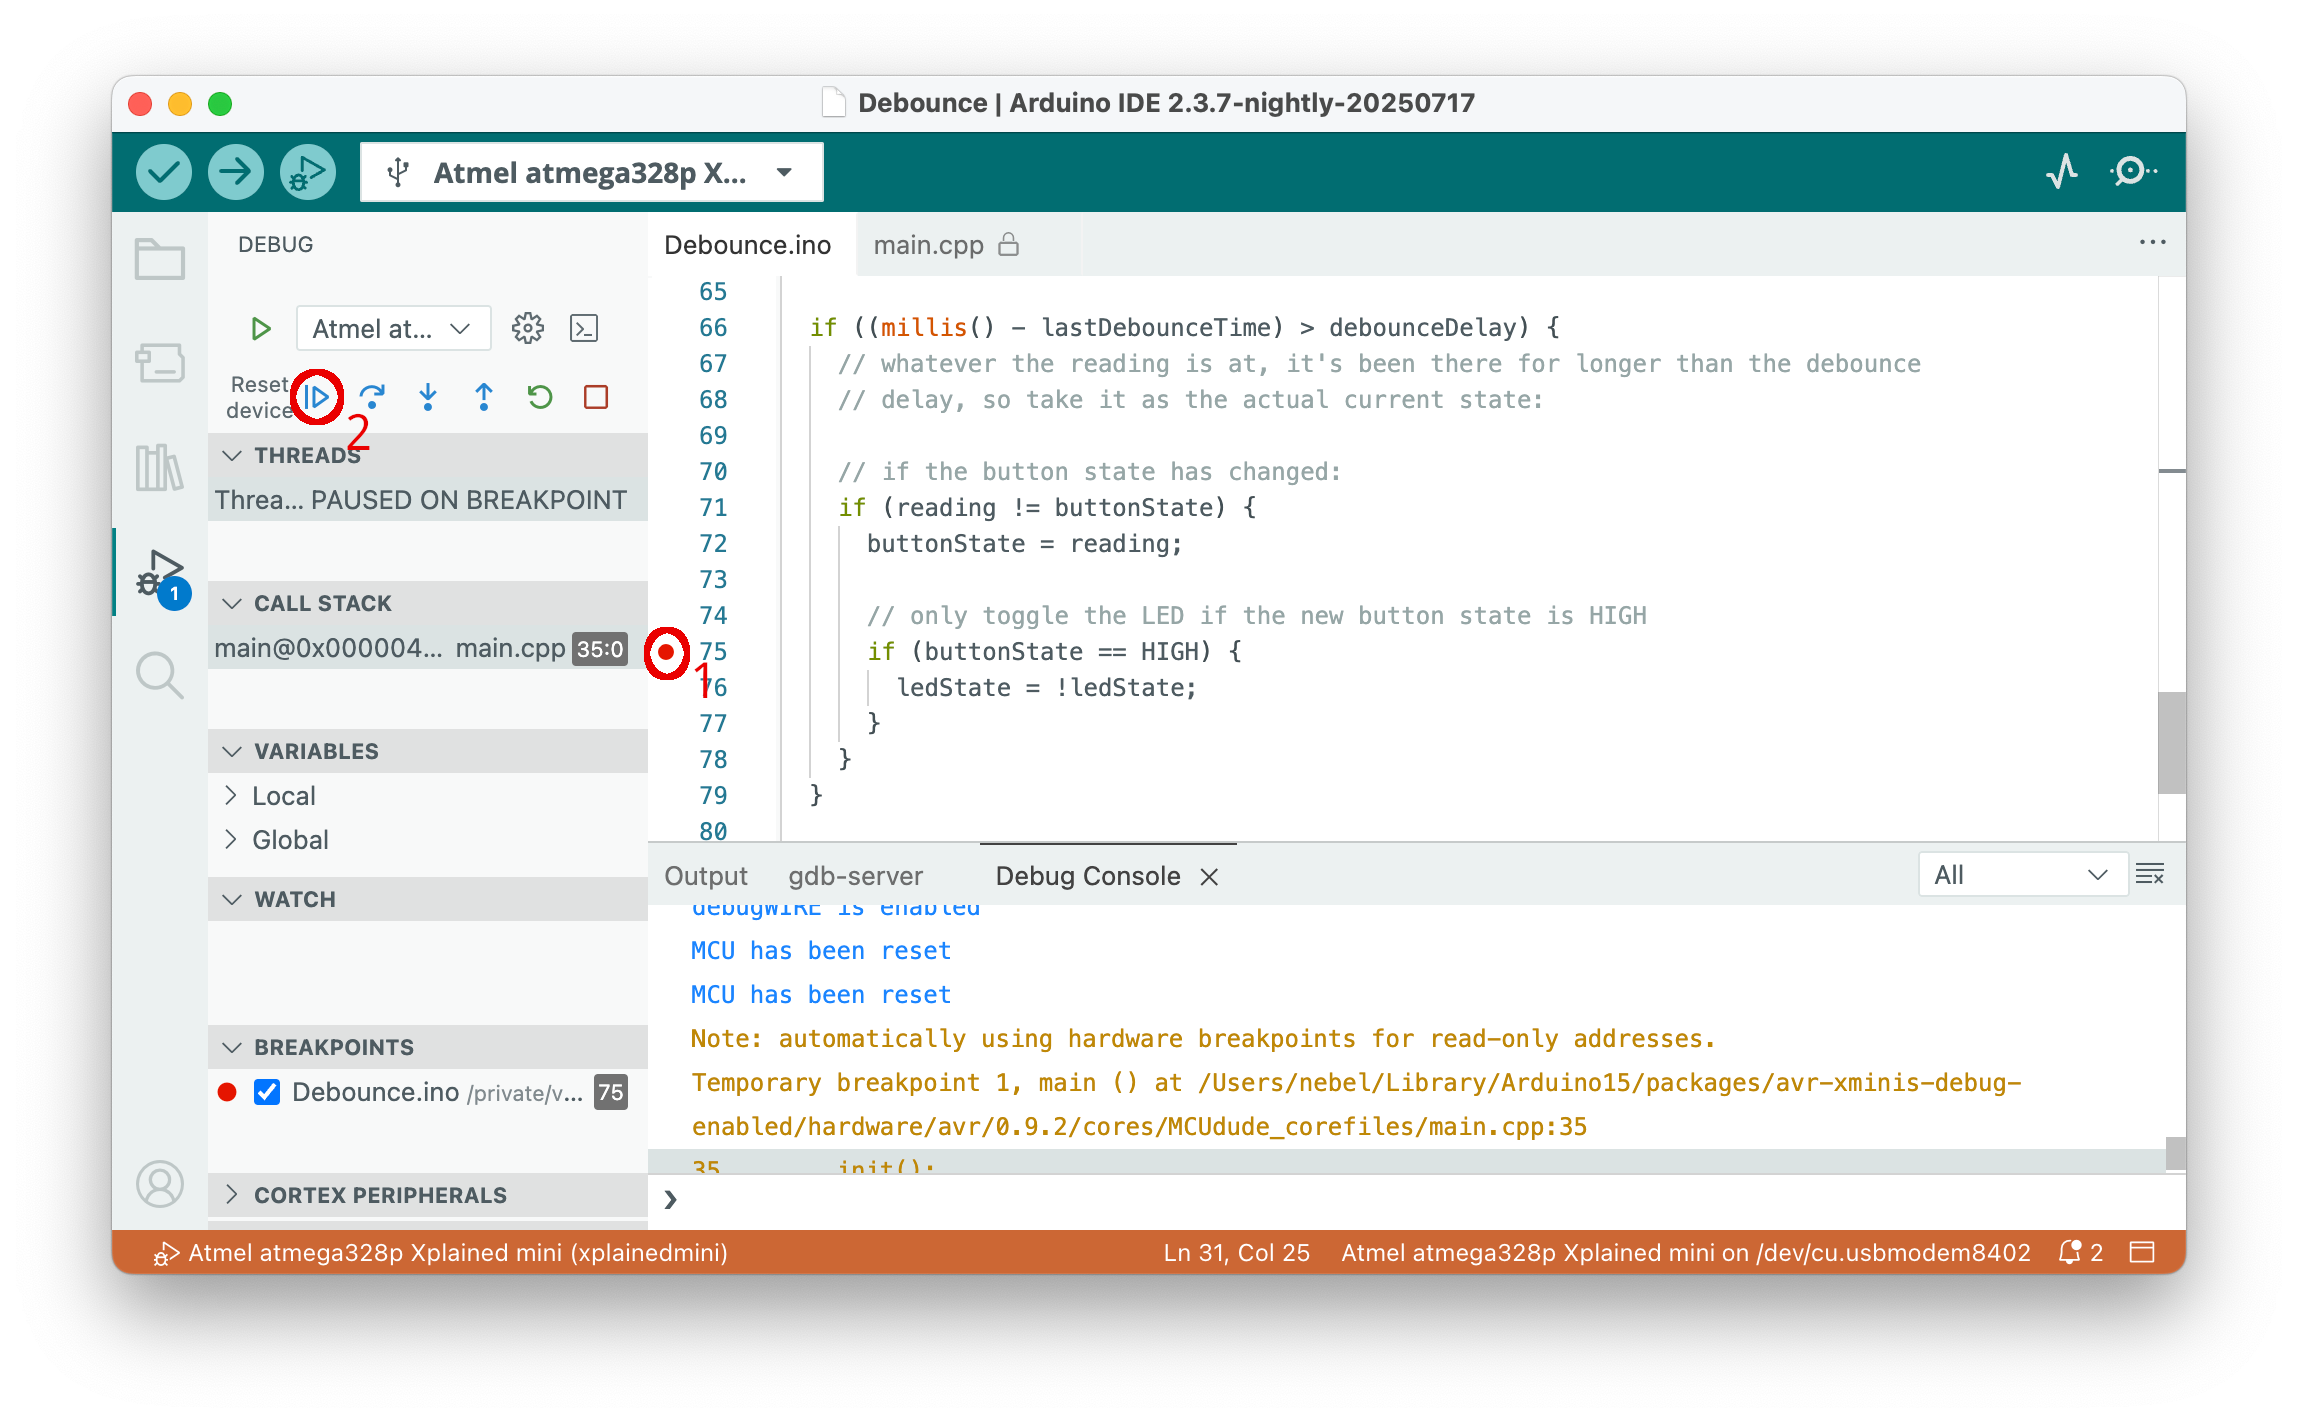
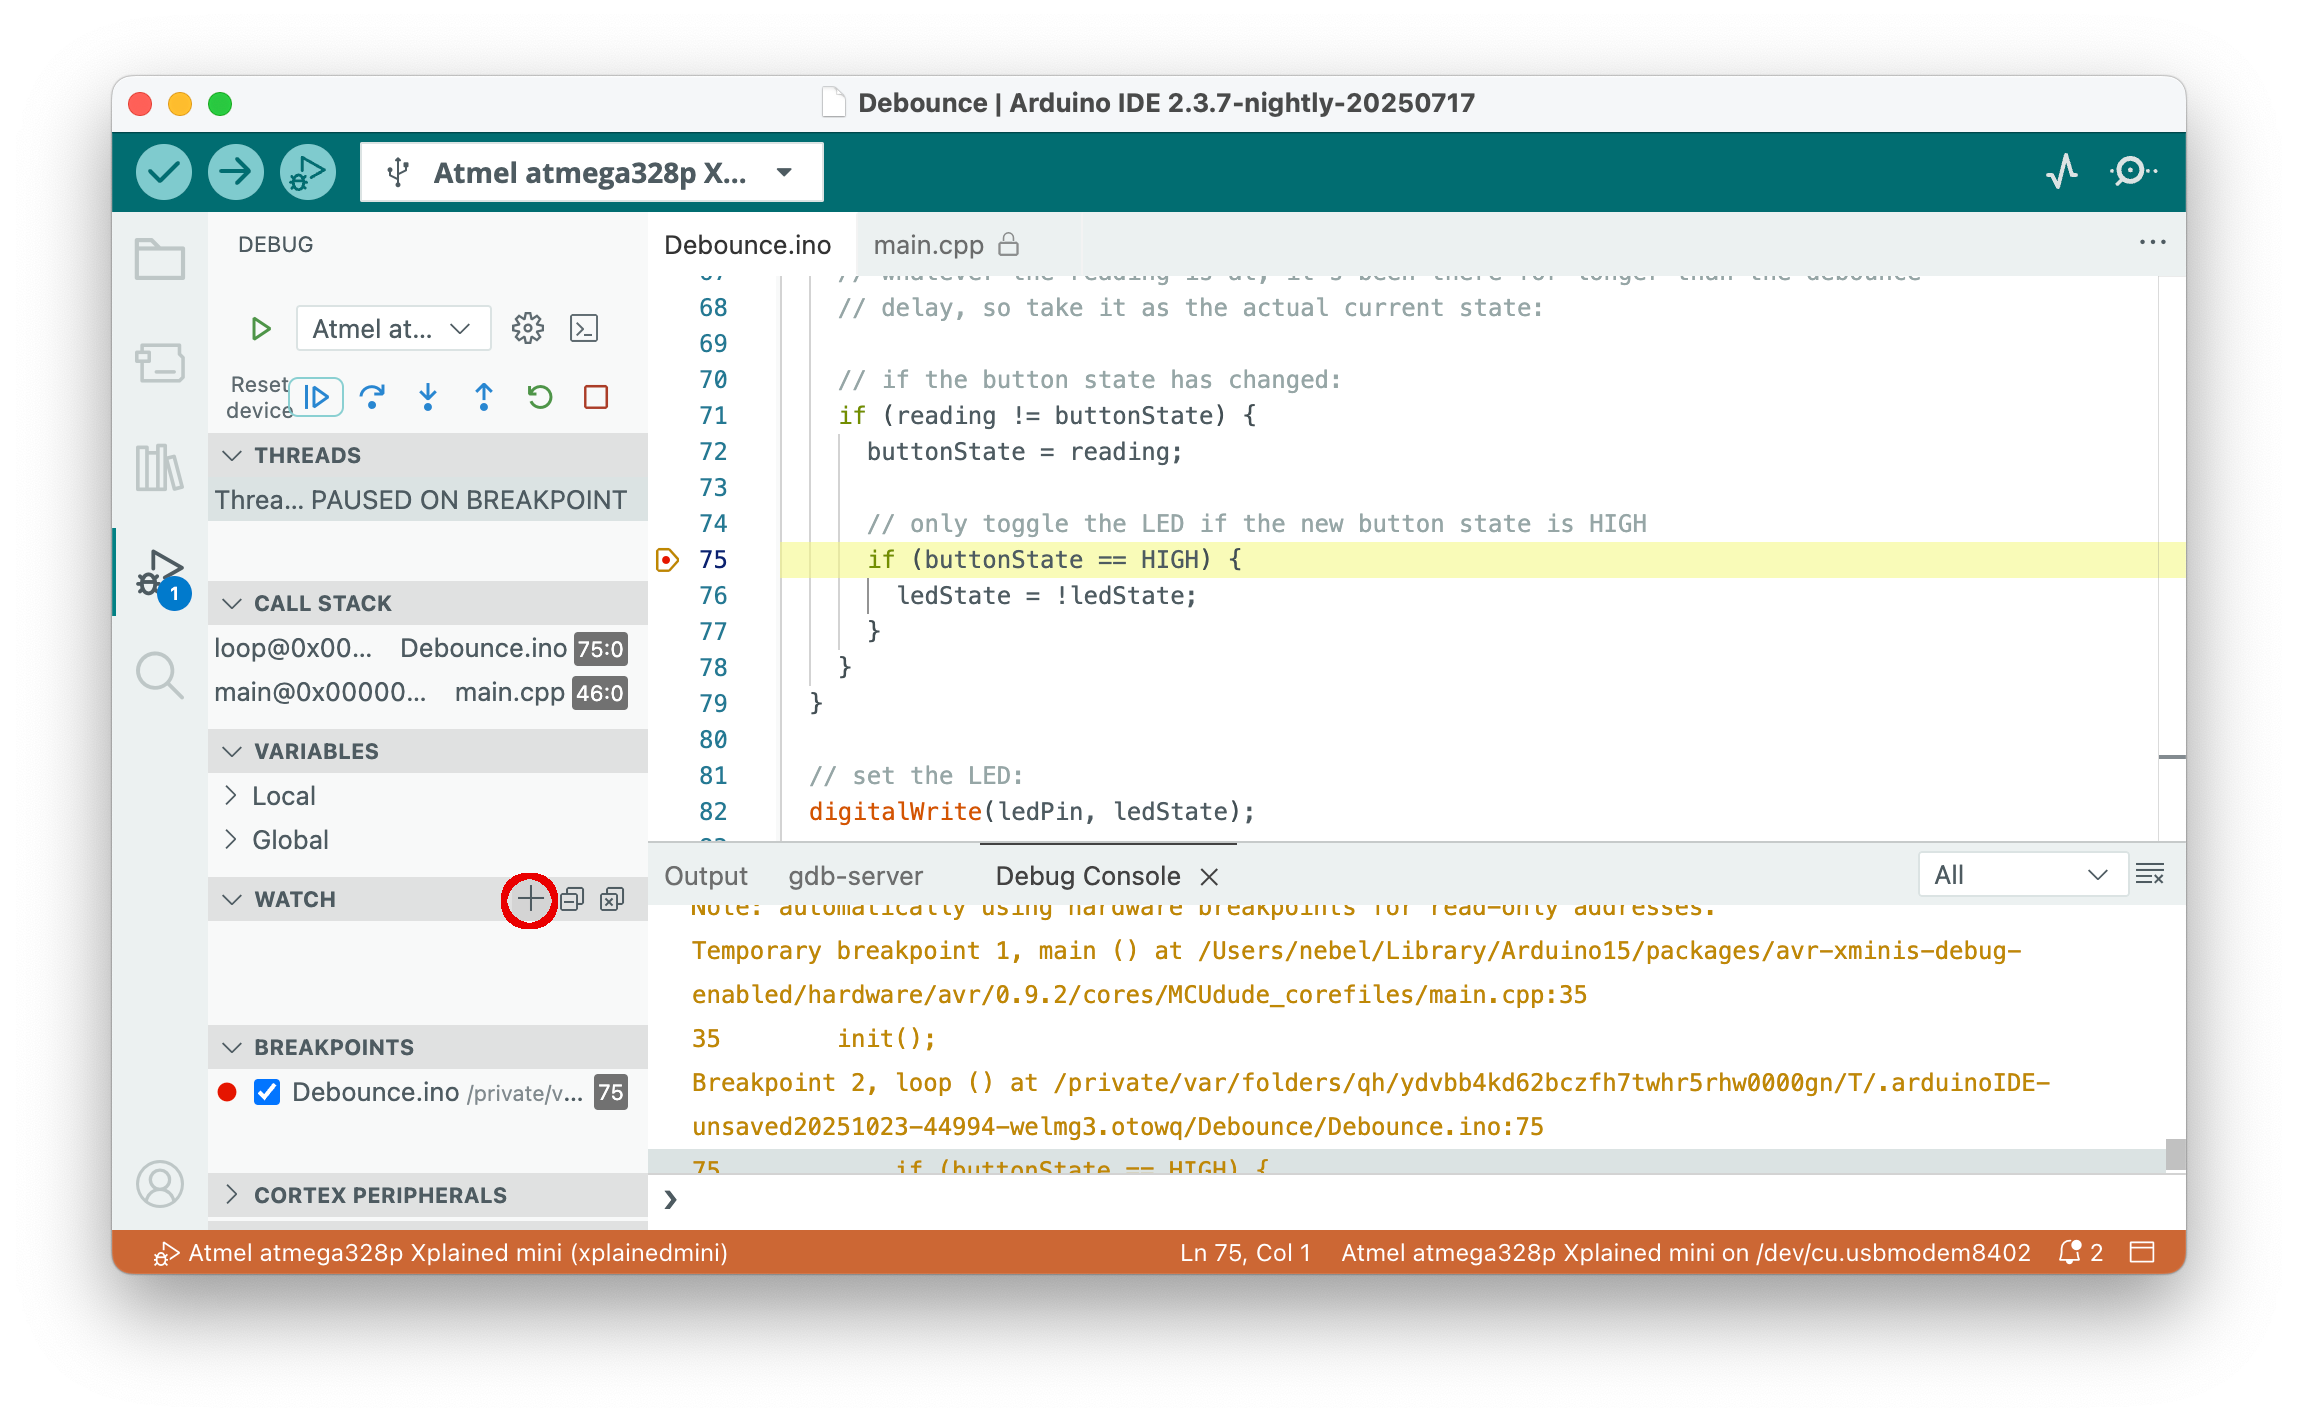
Sketch execution will be immediately stopped in line 75. Now we want to examine the values of some of the variables. If you hover with the mouse over a variable, its value will be shown. If we want to always track the value of the variable, we can use the watch window. Move with the mouse to the right part of the WATCH bar. Then a plus sign will appear. Clicking on it allows you to enter "watch" expressions.
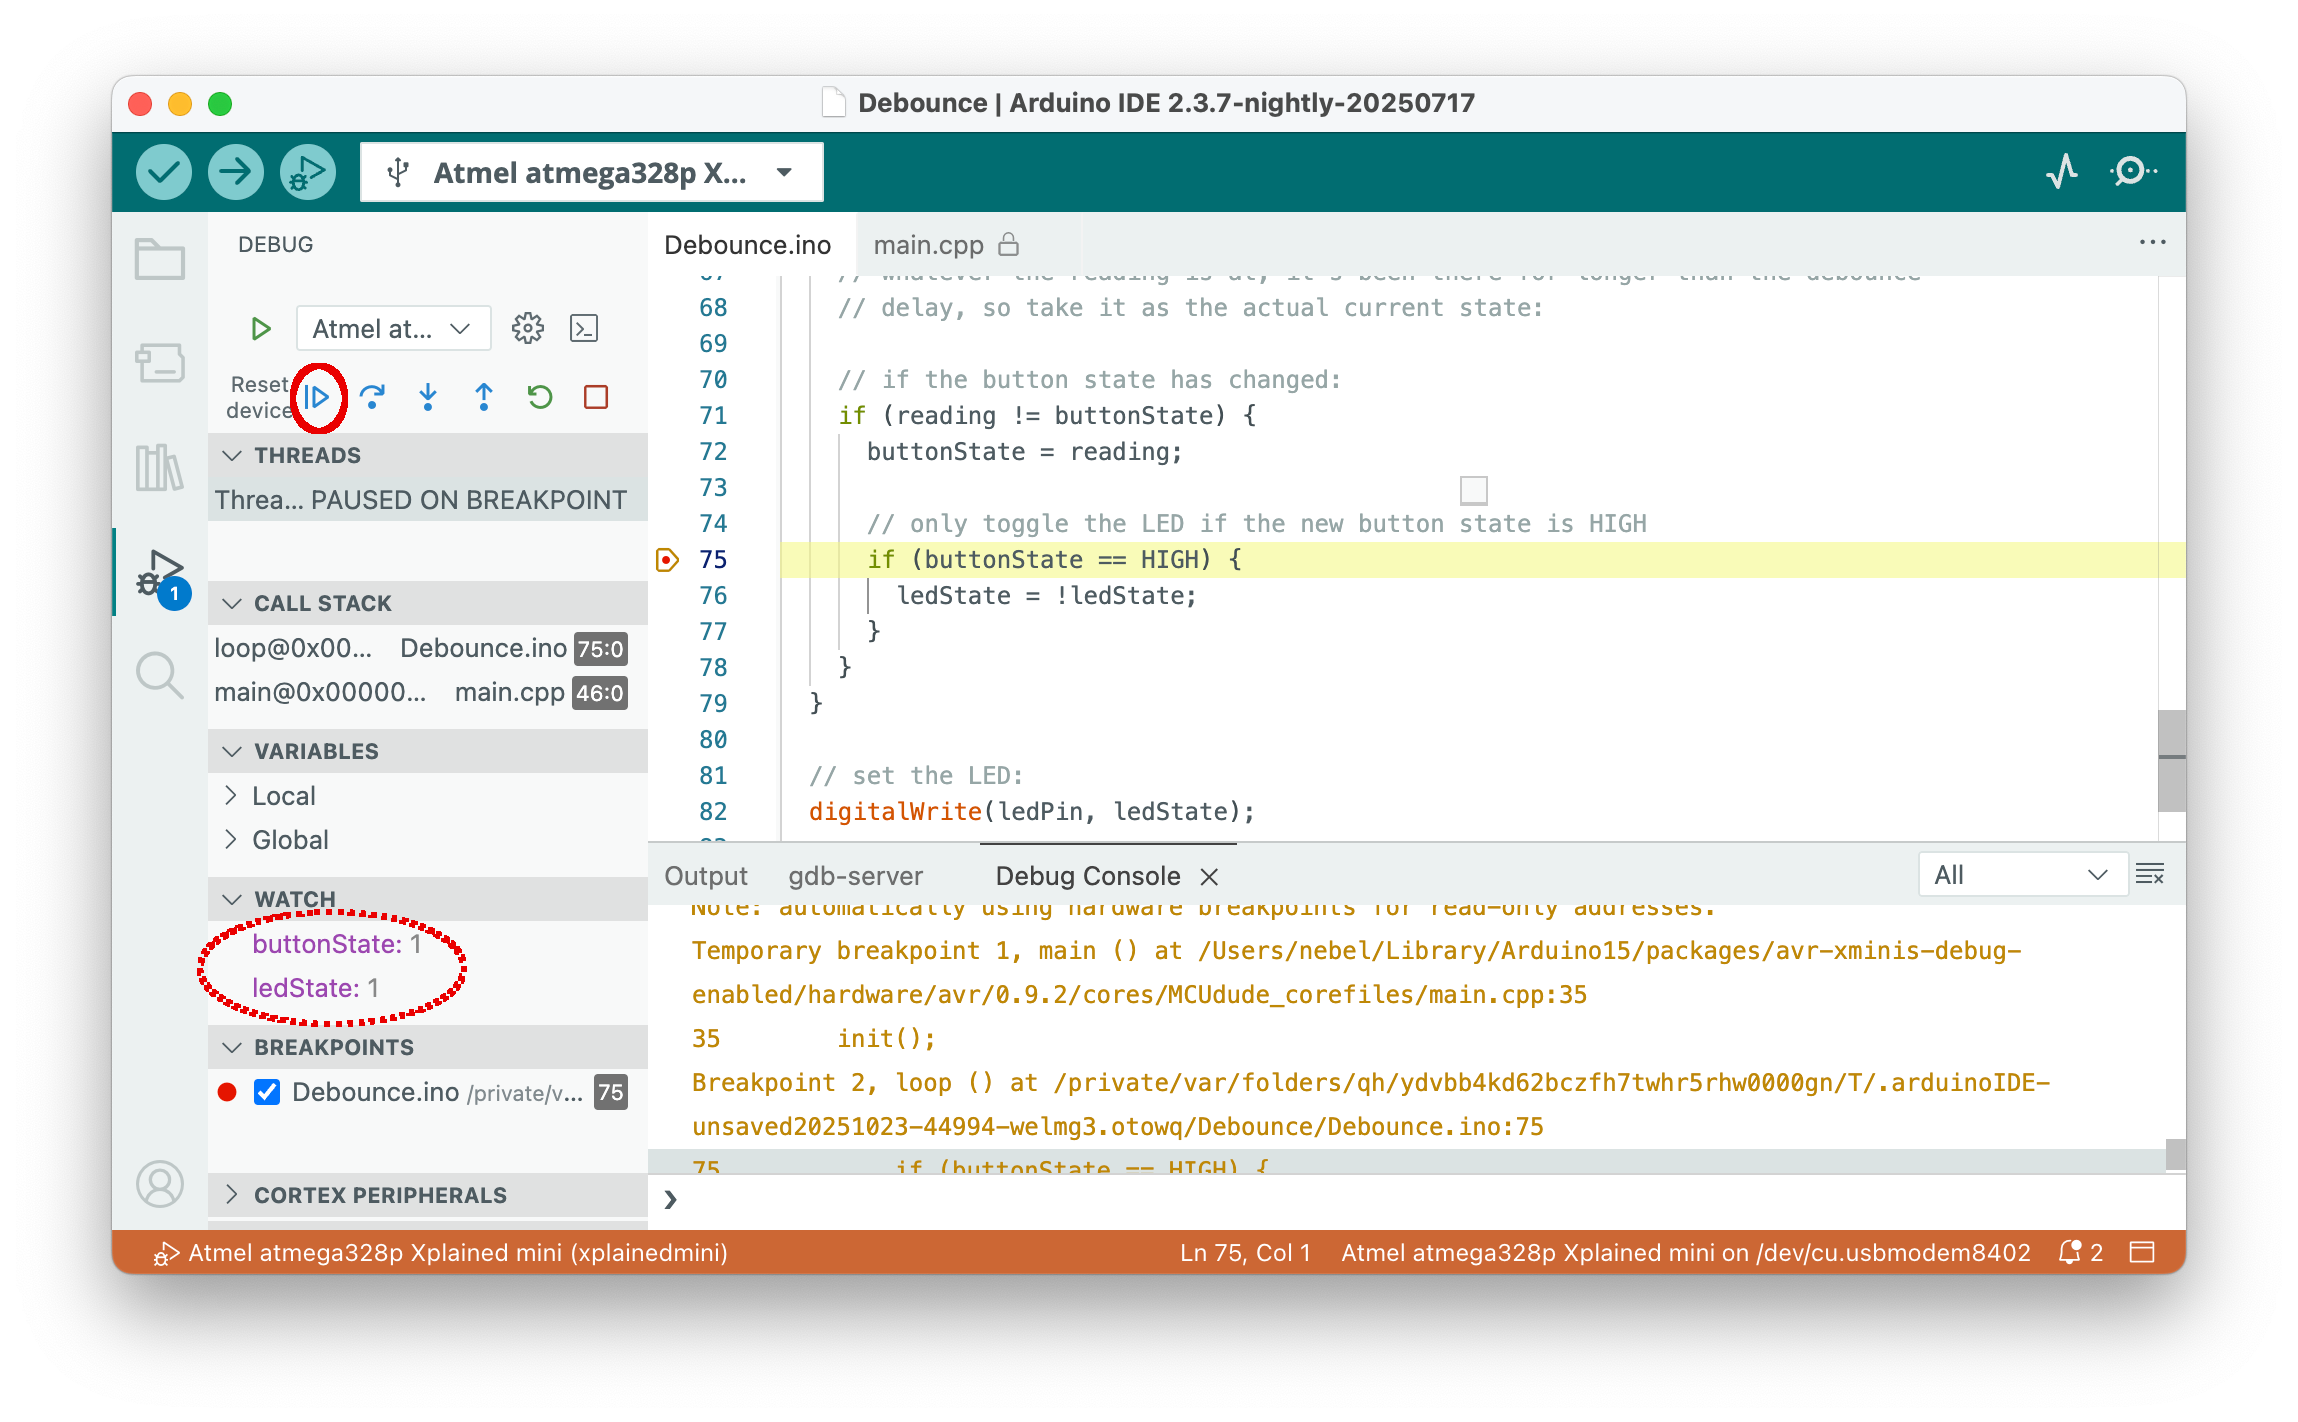
If we add buttonState and ledState to the WATCH pane, we see that they are both currently 1. If we now click the Continue button, ledState variable will be toggled (i.e., the LED will go dark) and the sketch will wait for a change of the button state.
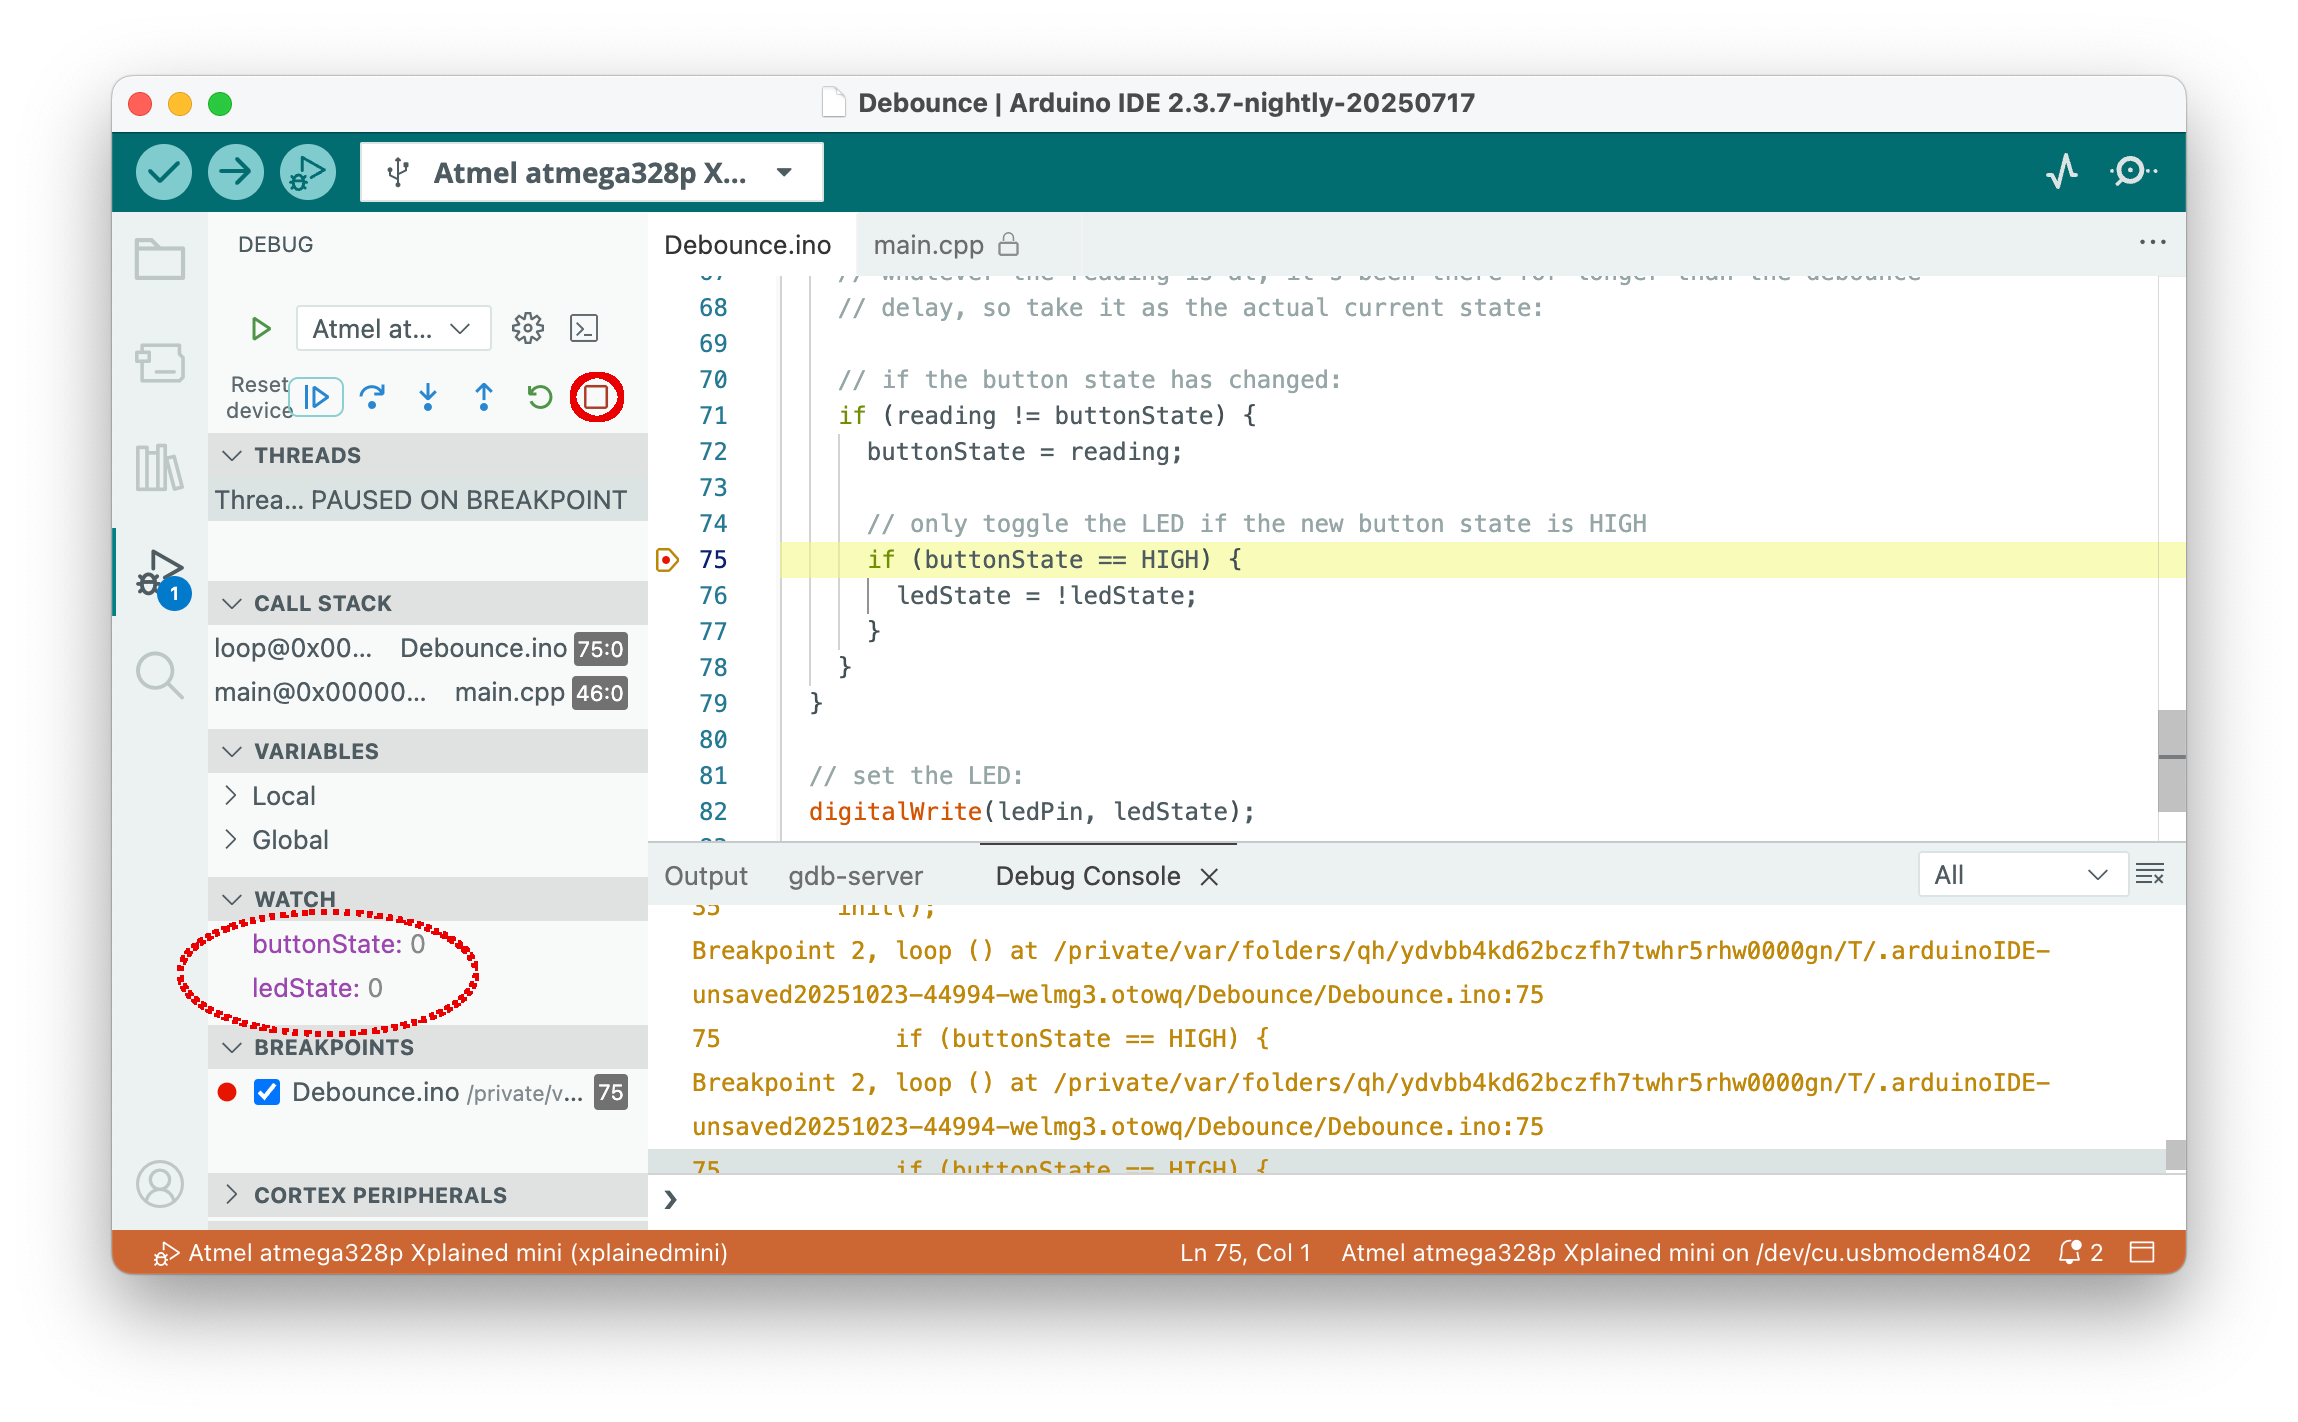
Pressing the button changes the level and will stop again in line 75, as shown below. The value of both variables is now 0. From here on, you can explore the debugger on your own. Hovering the mouse over symbols and names will bring up a short explanation. In this tutorial, we will now stop and press the exit symbol (red square).
Step 6: Start over or terminate the debugging session
You can now edit the sketch and start again at step 4. Note that you always have to recompile and restart the debugger before any changes you made to the sketch are effective. In fact, changing the source text while you are debugging is not a good idea, because the correspondence between the compiled code and the source code will be lost.
Instead of starting a new edit/compile/debug cycle, you may want to call it a day and end debugging. In this case, it may be a good idea to disable the Optimize for Debugging flag in the Sketch menu, because not doing so will result in larger code next time you compile a sketch.
Potential problems
There is always the chance that something goes south, either debugging does not start at all, or something funny happens while debugging. If so, it is a good idea to have a look at the output of the gdb-server console. Messages with the prefix [CRITICAL] often tell what went wrong. It may also be a good idea to consult the Troubleshooting and the Limitations section of the PyAvrOCD manual.
Warning: Do not source attached circuits through the 5V or 3V pin. Use IOREF!
If you have any attached circuitry, be it on a breadboard or a shield, use the IOREF pin to power it.
The reason for this is that the IOREF pin is under the switching control of the onboard debugger. So, if a power cycle is necessary to bring the MCU into debugWIRE mode, then the MCU as well as IOREF will be connected to GND and then powered again. The 5V/3V pins are not switched and deliver always power. This could lead to the situation that the MCU will be powered through its I/O pins, which is not healthy for the chip and will also prohibit that the MCU switches to debugWIRE mode.