Quickstart Guides: PlatformIO
The following three quickstart guides provide an easy entrance into the the wonderful land of debugging using PlatformIO.
Quickstart: ATmega328P Xplained Mini
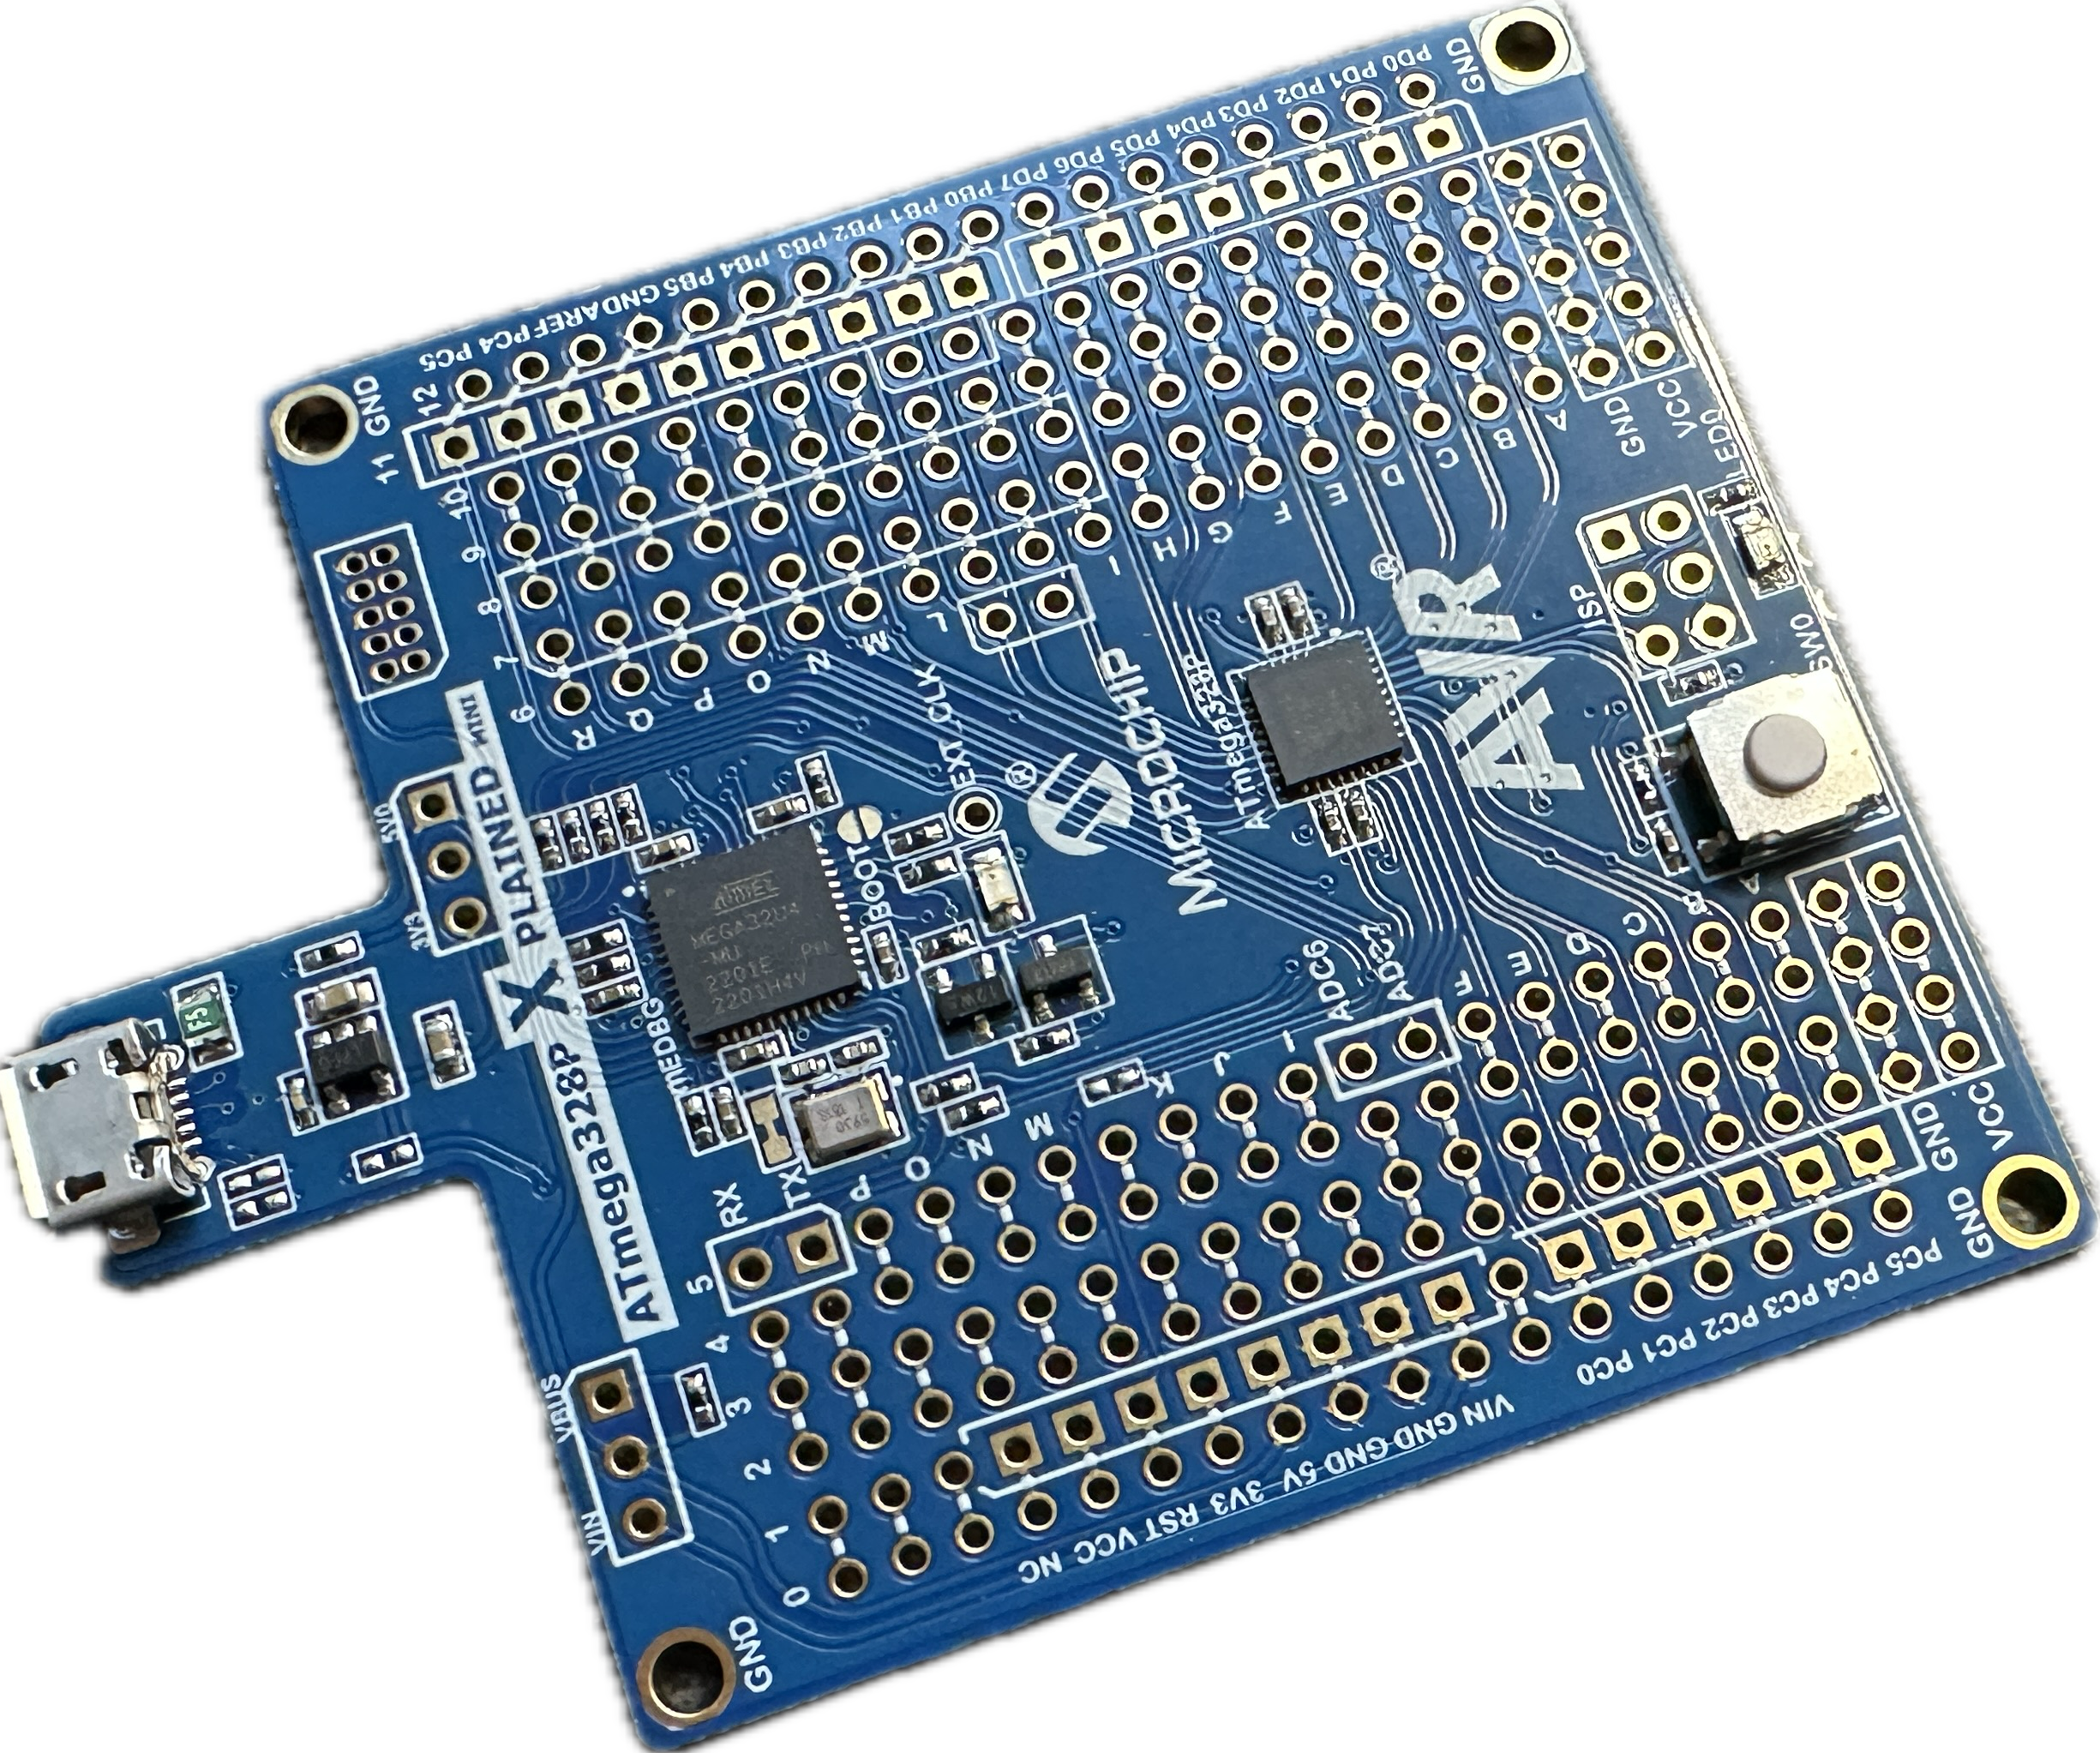
The Atmega328P Xplained Mini development board, which has an Arduino Uno footprint, is ideal for making a first experience with embedded debugging because it already contains an onboard debugger. It is simply plug-and-play.
Required hardware
The only thing needed is the XPlained Mini board and a USB cable to connect it to your computer.
Step 1: Set up a project with the right platform
Set up a PlatformIO project, e.g., by importing arduino-blink from the example projects. Add the following to your platformio.ini configuration file, making the new xmini environment the default environment:
[platformio]
default_envs = xmini

[env:xmini]
platform = https://github.com/felias-fogg/platform-atmelavr.git
framework = arduino
board = xmini328p
debug_tool = pyavrocd
Step 2: Debug the program
Click the debug symbol (bug in front of the triangle) in the left side bar, which will bring up the debug panes on the left side. Then, click the green triangle at the top.
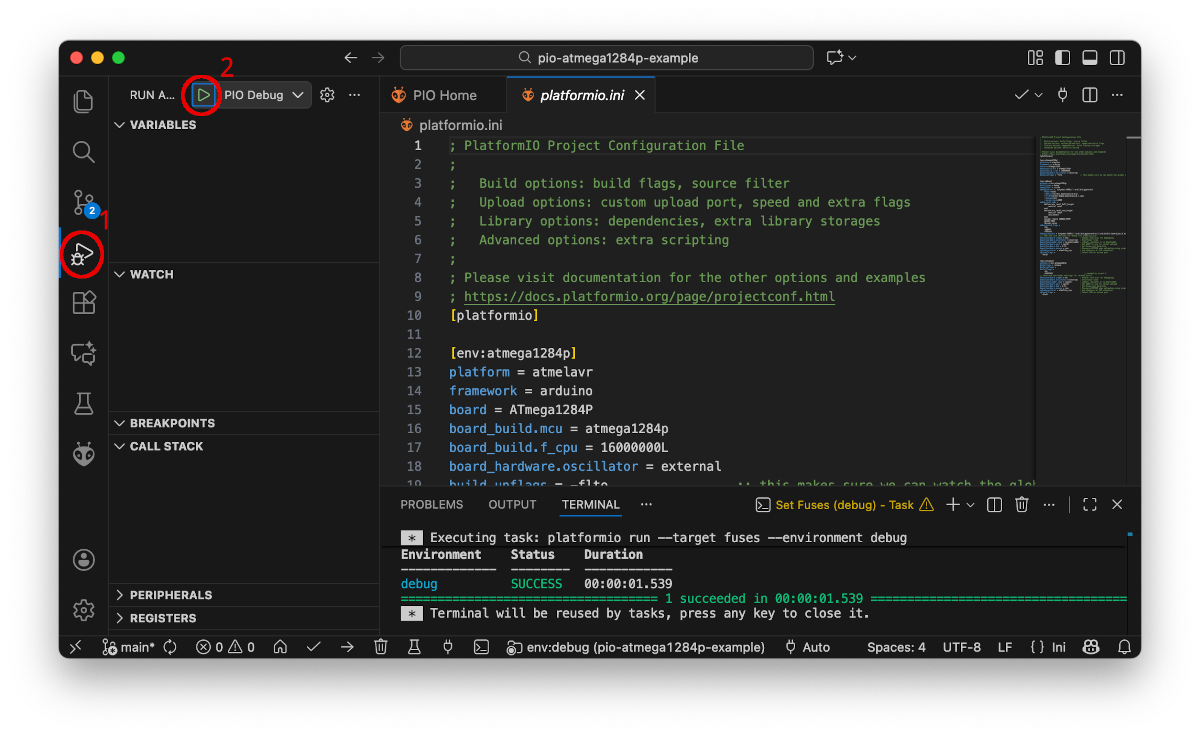
This will start the compilation process, and after that, the debug server. The code will be uploaded, and execution will begin. A first temporary stop is made in the main function. A yellow triangle and the highlighted line signify this. How you can control program execution, and inspect and change the internal state is sketched in the debugging section.
Step 3: Start over or terminate the debugging session
If you have found the bug you were hunting, you can now leave the editor (red square), edit the program, and start again at step 5. Note that you always have to restart the debugger before any changes you made to the program are effective. In fact, changing the source text while you are debugging is not a good idea, because the correspondence between the compiled code and the source code will be lost.
Instead of starting a new edit/compile/debug cycle, you may want to call it a day and end debugging. In this case, you may wish to switch the MCU back into normal mode, in which ordinary SPI programming is possible. This can be accomplished by typing the command monitor debugwire disable into the input line of the DEBUG CONSOLE window (1) just before terminating the debugger (2).
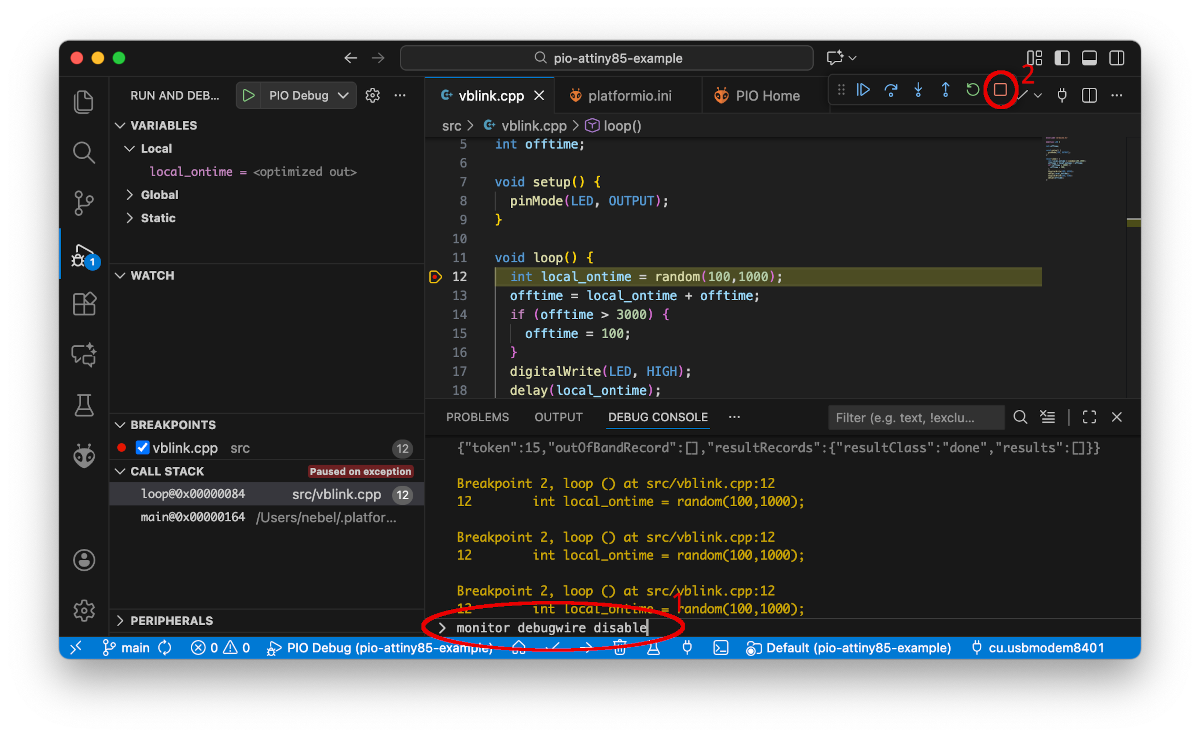
Alternatively, you can also use the Disable debugWIRE project task under the Platform heading to disable debugWIRE mode.
Potential Problems
There is always the chance that something goes south, either debugging does not start at all, or something funny happens while debugging. If so, it is a good idea to have a look at the output in the DEBUG CONSOLE. Messages with the prefix [CRITICAL] often tell what went wrong. It may also be a good idea to consult the Troubleshooting and the Limitations sections of the PyAvrOCD manual.
Warning: Use IOREF to source attached circuits
If you have any attached circuitry, be it on a breadboard or a shield, use the IOREF pin to power it. If this is not possible, check out the README file of XminiCore for a solution.
Quickstart: Atmel-ICE & ATmega1284
This quickstart guide shows you how to set up a PlatformIO project for debugging a JTAG target using an EDBG-based debug probe.
Required hardware
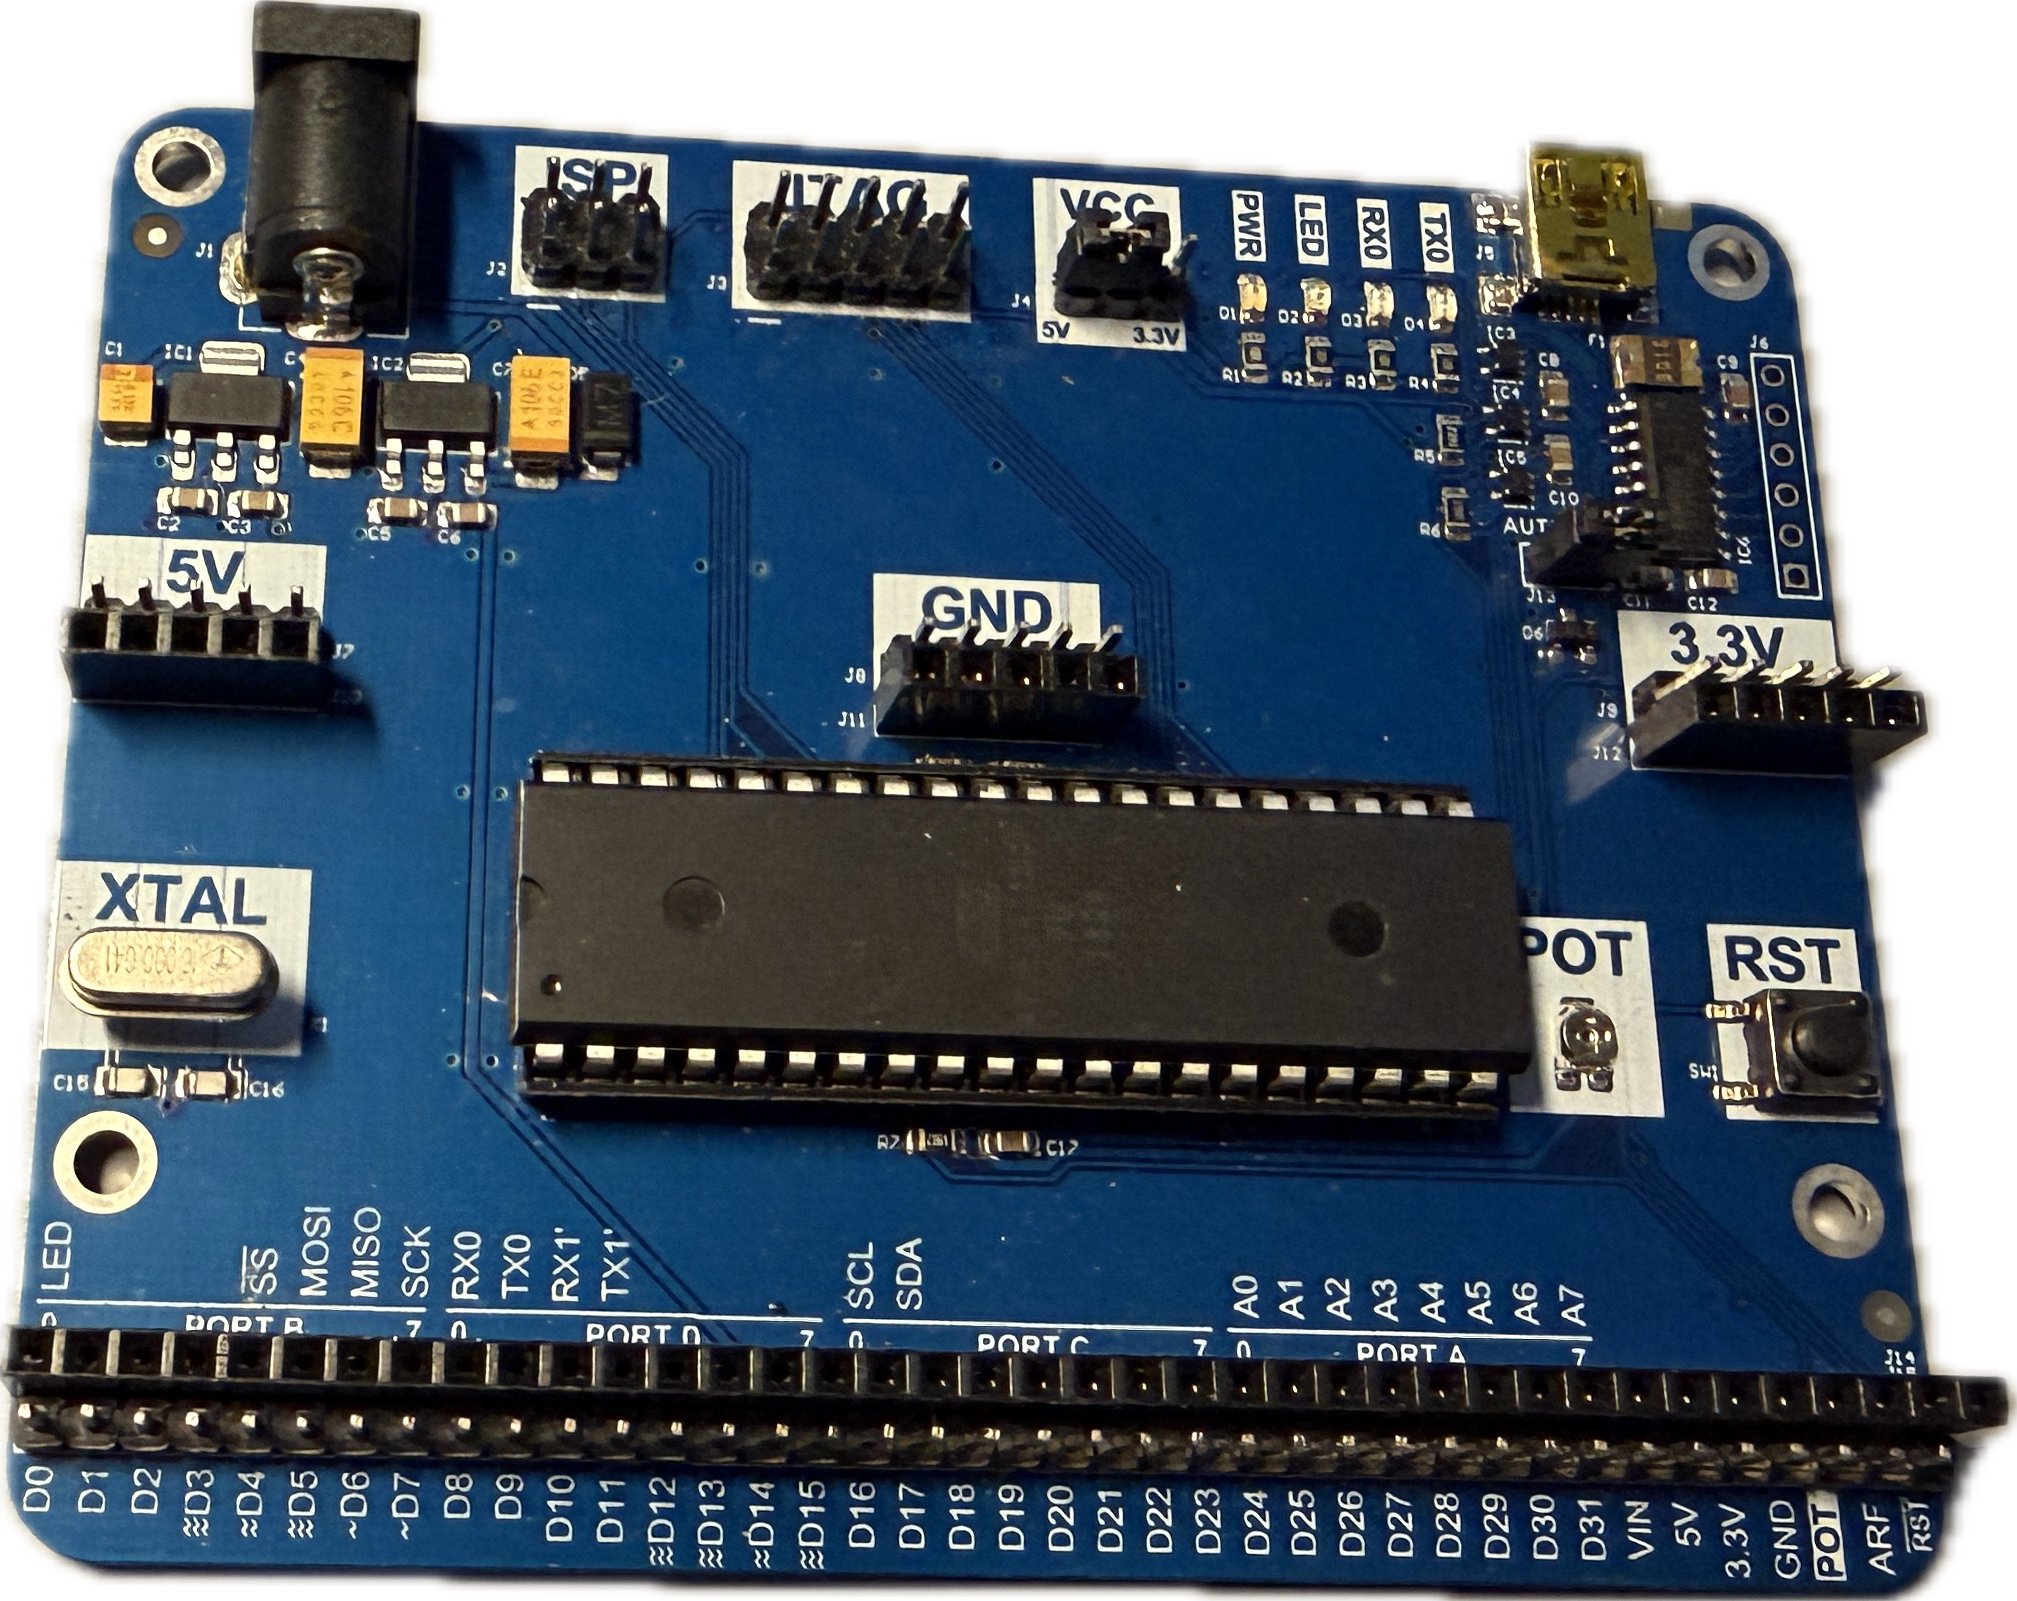
We will use an ATmega1284 (but any other AVR JTAG Mega will do) and the debug probe Atmel-ICE (any other EDBG-based debug probe is also OK). In addition, we will use the DIP-40 Arduino-compatible development board to demonstrate basic debugging, but again, any board with a JTAG and ISP connector would do.
In the following, I will assume that PlatformIO, as an extension of VSCode, has been installed already and that you are somewhat familiar with it.
Step 1: Set up a project with the right platform
Set up a PlatformIO project and instead of using atmelavr as the platform, specify the following in your platformio.ini configuration file:
...
platform = https://github.com/felias-fogg/platform-atmelavr.git
framework = arduino
board = ATmega1284P
...
The best way to start is to clone or download the following repository.
https://github.com/felias-fogg/pio-atmega1284p-example
The plaformio.ini file contains the following sections:
[env:atmega1284p]
;;contains all information about the platform & chip and
;;how to commuincate with Atmel-ICE
...

[env:debug]
;; enables debugging
...

[env:release]
;; supports uploading in release mode
...
Step 2: Prepare the board for debugging
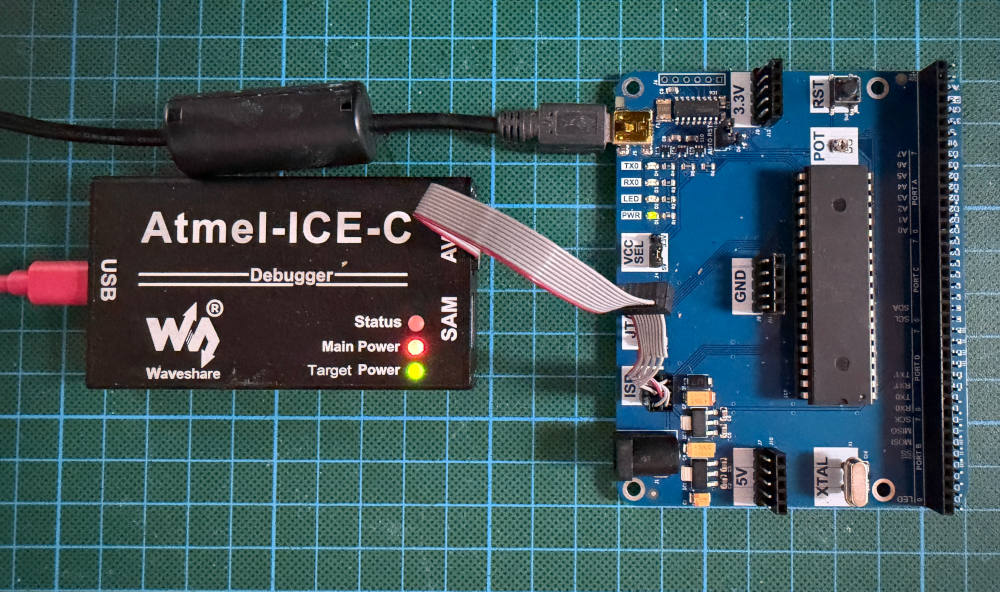
Before debugging can take place, you need to make sure that the JTAG pins are enabled. On an ATmega1284P, these are the pins PC2—PC5. Fresh from the factory, the JTAG pins are enabled. However, on Arduino boards, they are by default disabled. Since the state is probably unknown, we will set it anyway. In order to activate the JTAG pins, we need to connect the Atmel-ICE to the board using the ISP connection, as shown in the following photo. On this board, the key or marker of the ISP plug should be oriented towards the MCU.
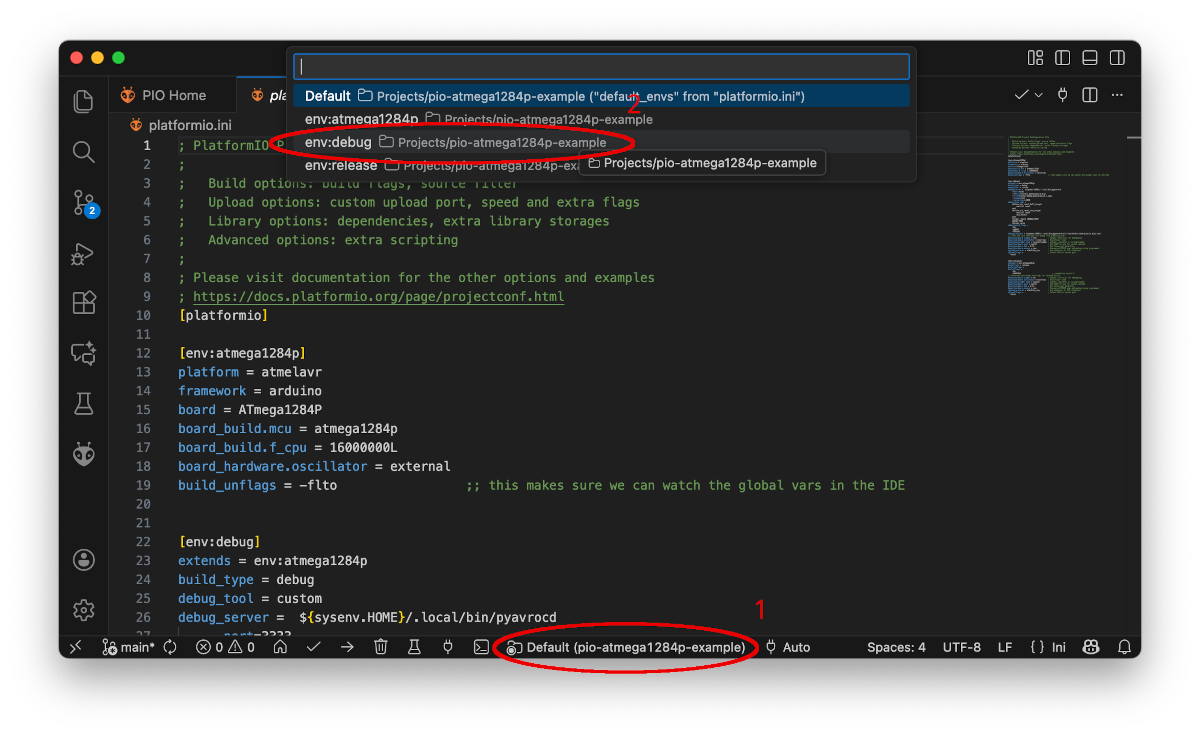
In order to set the correct fuses, we now select the debug environment by first clicking on the environment symbol in the bottom line and then choosing the right environment at the top.
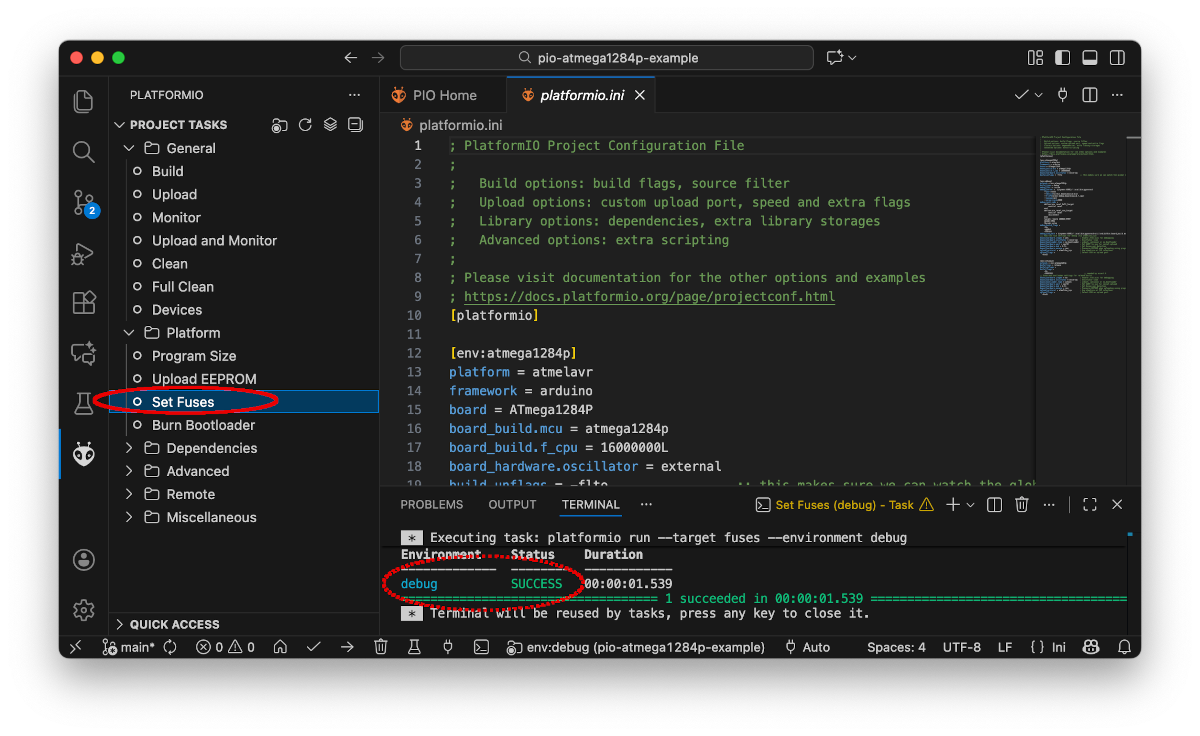
After that, we request that the fuses be set by clicking on Set Fuses. The result of this action is displayed in the Terminal window and should be as shown in the picture below.
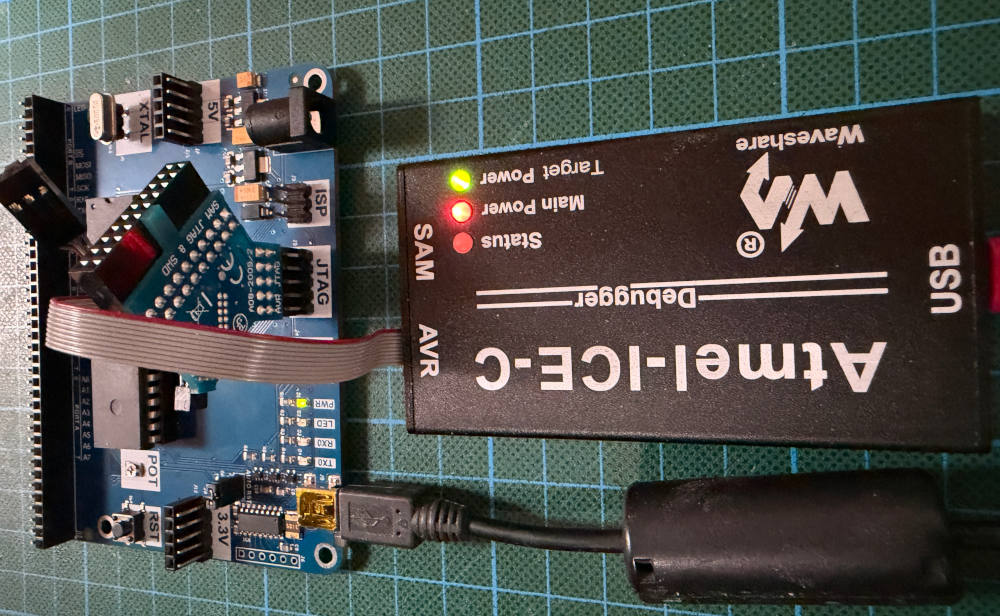
Before we can start debugging, we need to change the connection between the debug probe and the target board from ISP to JTAG, as shown in the following picture. As with the ISP plug, the keying or marker should be oriented towards the MCU on this board.
Step 3: Debug the program
If you have not activated the debug environment, now is the time to do it (as shown in the previous step). And then we are ready to go into business seriously. First, click the debug symbol (bug in front of the triangle) in the left side bar, which will bring up the debug panes on the left side. Then, click the green triangle at the top.
This will start the compilation process, and after that, the debug server. The code will be uploaded, and execution will begin. A first temporary stop is made in the main function. A yellow triangle and the highlighted line signify this. How you can control the program is sketched in the debugging section.
Step 4: Start over or terminate the debugging session
If you have found the bug you were hunting, you can now leave the editor (red square), edit the program, and start again at step 5. Note that you always have to restart the debugger before any changes you made to the program are effective. In fact, changing the source text while you are debugging is not a good idea, because the correspondence between the compiled code and the source code will be lost.
Instead of starting a new edit/compile/debug cycle, you may want to call it a day and end debugging. In this case, you may wish to disable the JTAG pins, perhaps. Switch to the release environment and click Set Fuses again. Possibly, you even want to restore the bootloader, which was deleted when starting the debugger. In this case, you need to click Burn Bootloader.
Potential Problems
There is always the chance that something goes south, either debugging does not start at all, or something funny happens while debugging. If so, it is a good idea to have a look at the output in the DEBUG CONSOLE. Messages with the prefix [CRITICAL] often tell what went wrong. It may also be a good idea to consult the Troubleshooting and the Limitations sections of the PyAvrOCD manual.
One common problem is forgetting to change from ISP to JTAG or back. In this case, the debug probe complains that there is no device.
Quickstart: dw-link & ATtiny85
This quickstart guide demonstrates how to set up a PlatformIO project for debugging on an ATtiny85 without requiring you to invest in a commercial debug probe. Instead, we will build our own debug probe.
It explains
-
how to install the PyAvrOCD GDB server,
-
how to turn an Arduino UNO R3 into a debugWIRE debug probe using the dw-link firmware,
- how to set up the breadboard with the ATtiny85 on it, and
- how to use PlatformIO for debugging a program on the ATtiny.
Required hardware
- Arduino Uno (will become the debug probe)
- USB cable
- ATtiny85 as the target
- In order to connect the debug probe to the target, you need:
- a breadboard together with
- 11 Jumper wires (male-to-male)
- 2 LEDs
- 3 Resistors (10 kΩ, 220Ω, 220Ω)
- 2 Capacitors (100 nF, 10 µF)
Step 1: Set up a project with the right platform
Setup a PlatformIO project and instead of using atmelavr as the platform, specify the following in your platformio.ini configuration file:
[platformio]

[env:attiny85]
platform = https://github.com/felias-fogg/platform-atmelavr.git
framework = arduino
board = attiny85
...
The best way to start is to clone or download the following repository.
https://github.com/felias-fogg/pio-attiny85-example
The plaformio.ini file contains the following sections:
[platformio]
default_envs = debug

[env:attiny85]
;;contains all information about the platform & chip and
;;how to commuincate with dw-link
...

[env:debug]
;; enables debugging
...

[env:release]
;; supports uploading in release mode
...
Step 2: Turn an UNO into a debug probe
First, connect the UNO to your computer using the USB cable. Make sure that you have the permission to access the serial interface (under Linux).
The simplest way to install the firmware is to download an uploader from the Release assets of the GitHub repo. The uploader should fit your architecture, e.g., dw-uploader-windows-intel64 for Windows. Under Linux and macOS, open a terminal window, go to the download folder, and set the executable permission using chmod +x. Afterward, execute the program. Under Windows, it is enough to start the program after downloading by double-clicking on it.
Alternatively, you can download or clone the dw-link repository and then compile and upload the dw-link Arduino sketch using PlatformIO.
The Uno now acts as a debug probe providing a GDB RSP interface. If you configured the serial line to the Uno as 115200 baud, and click on Monitor in the PROJECT TASK menu, select the Terminal window, and then type a minus sign into this window, you should get the response "$#00". If you type Ctrl-E, the probe should respond with "dw-link".
Step 3: Set up the hardware
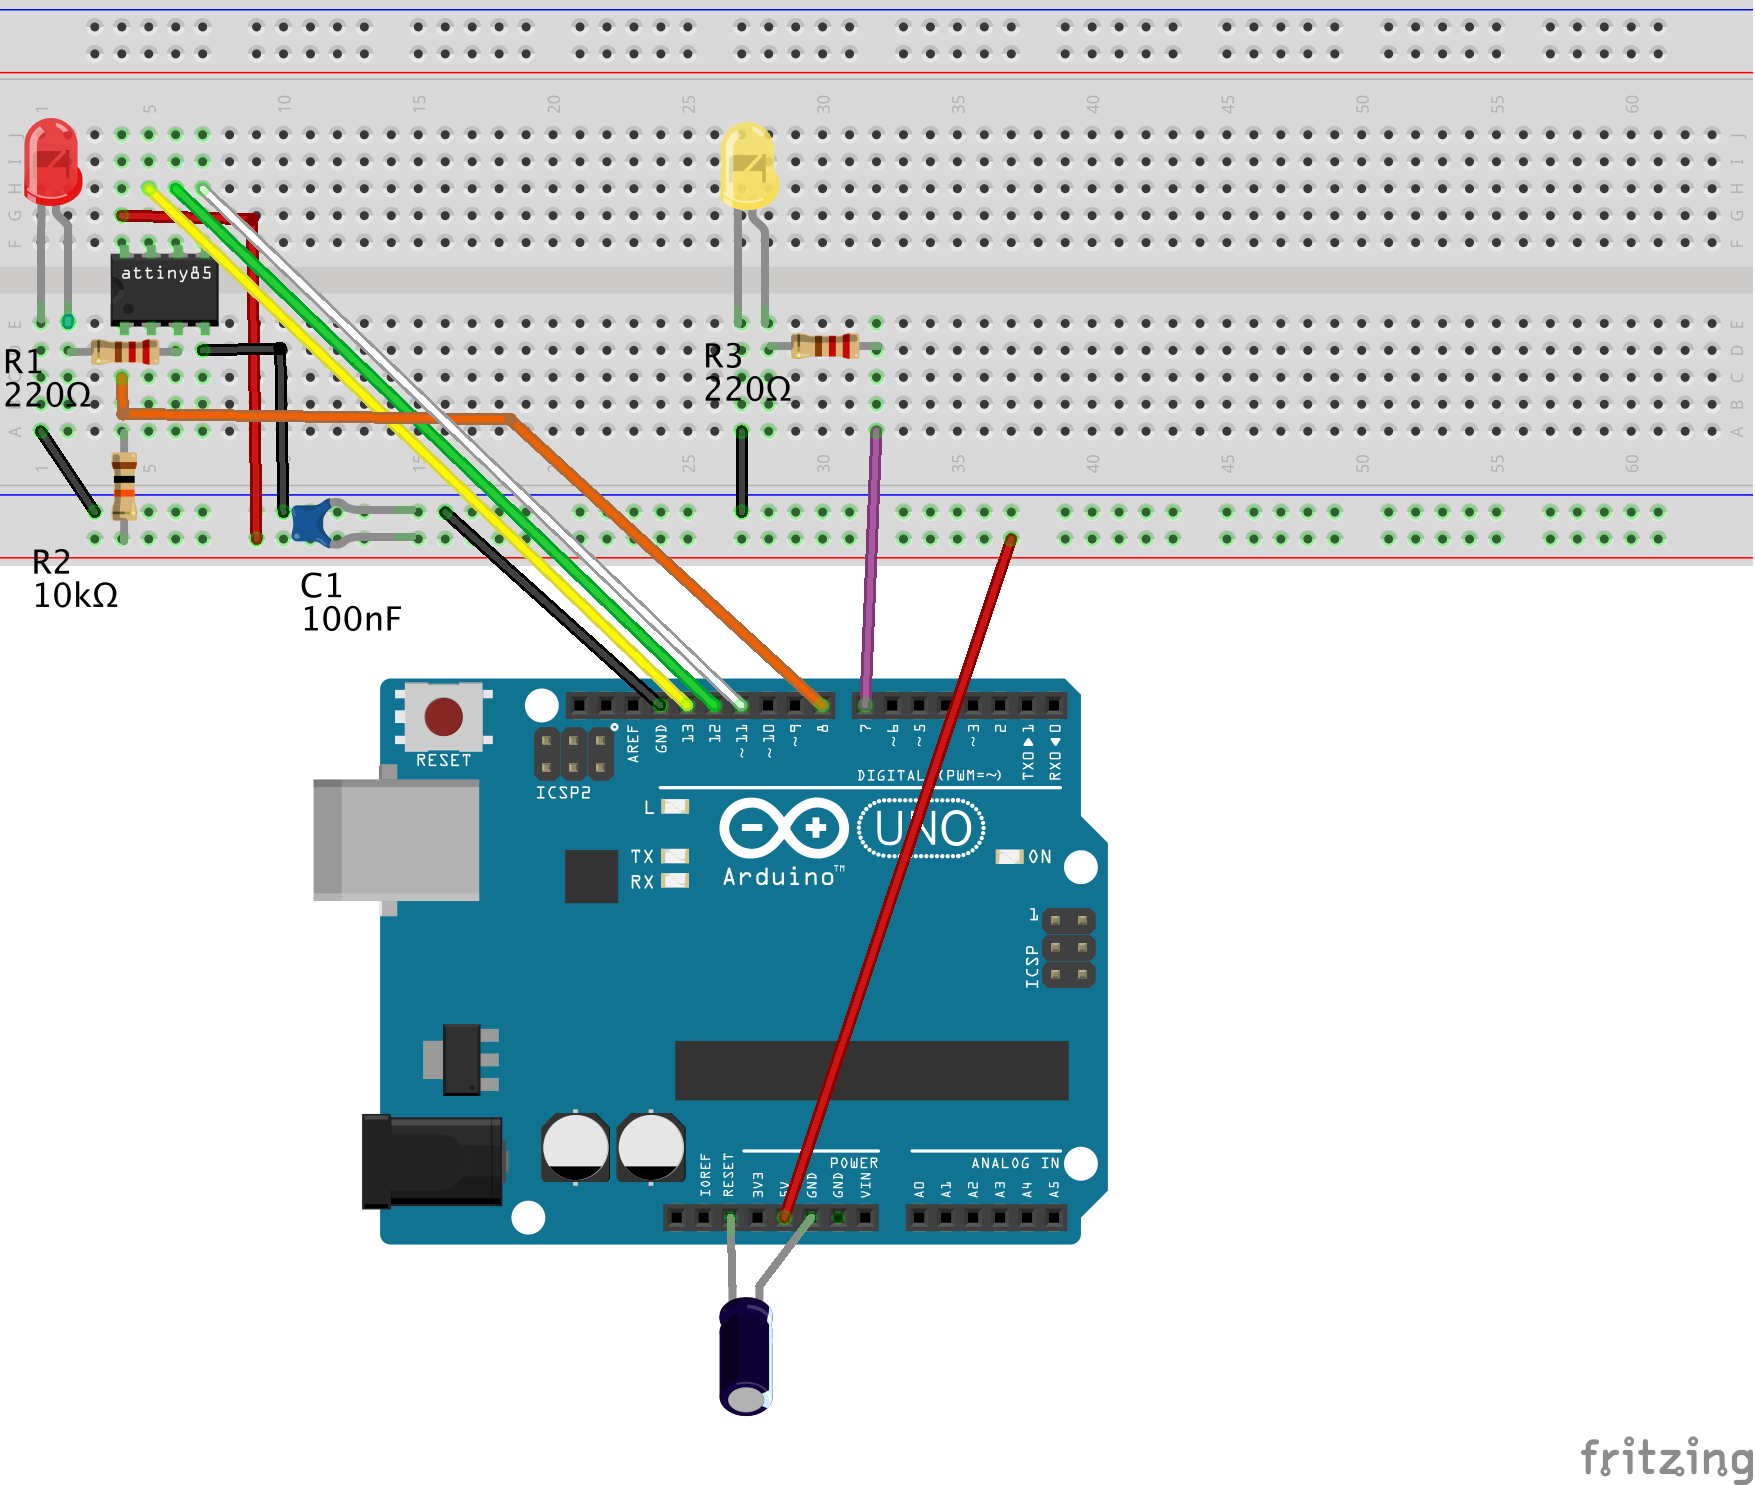
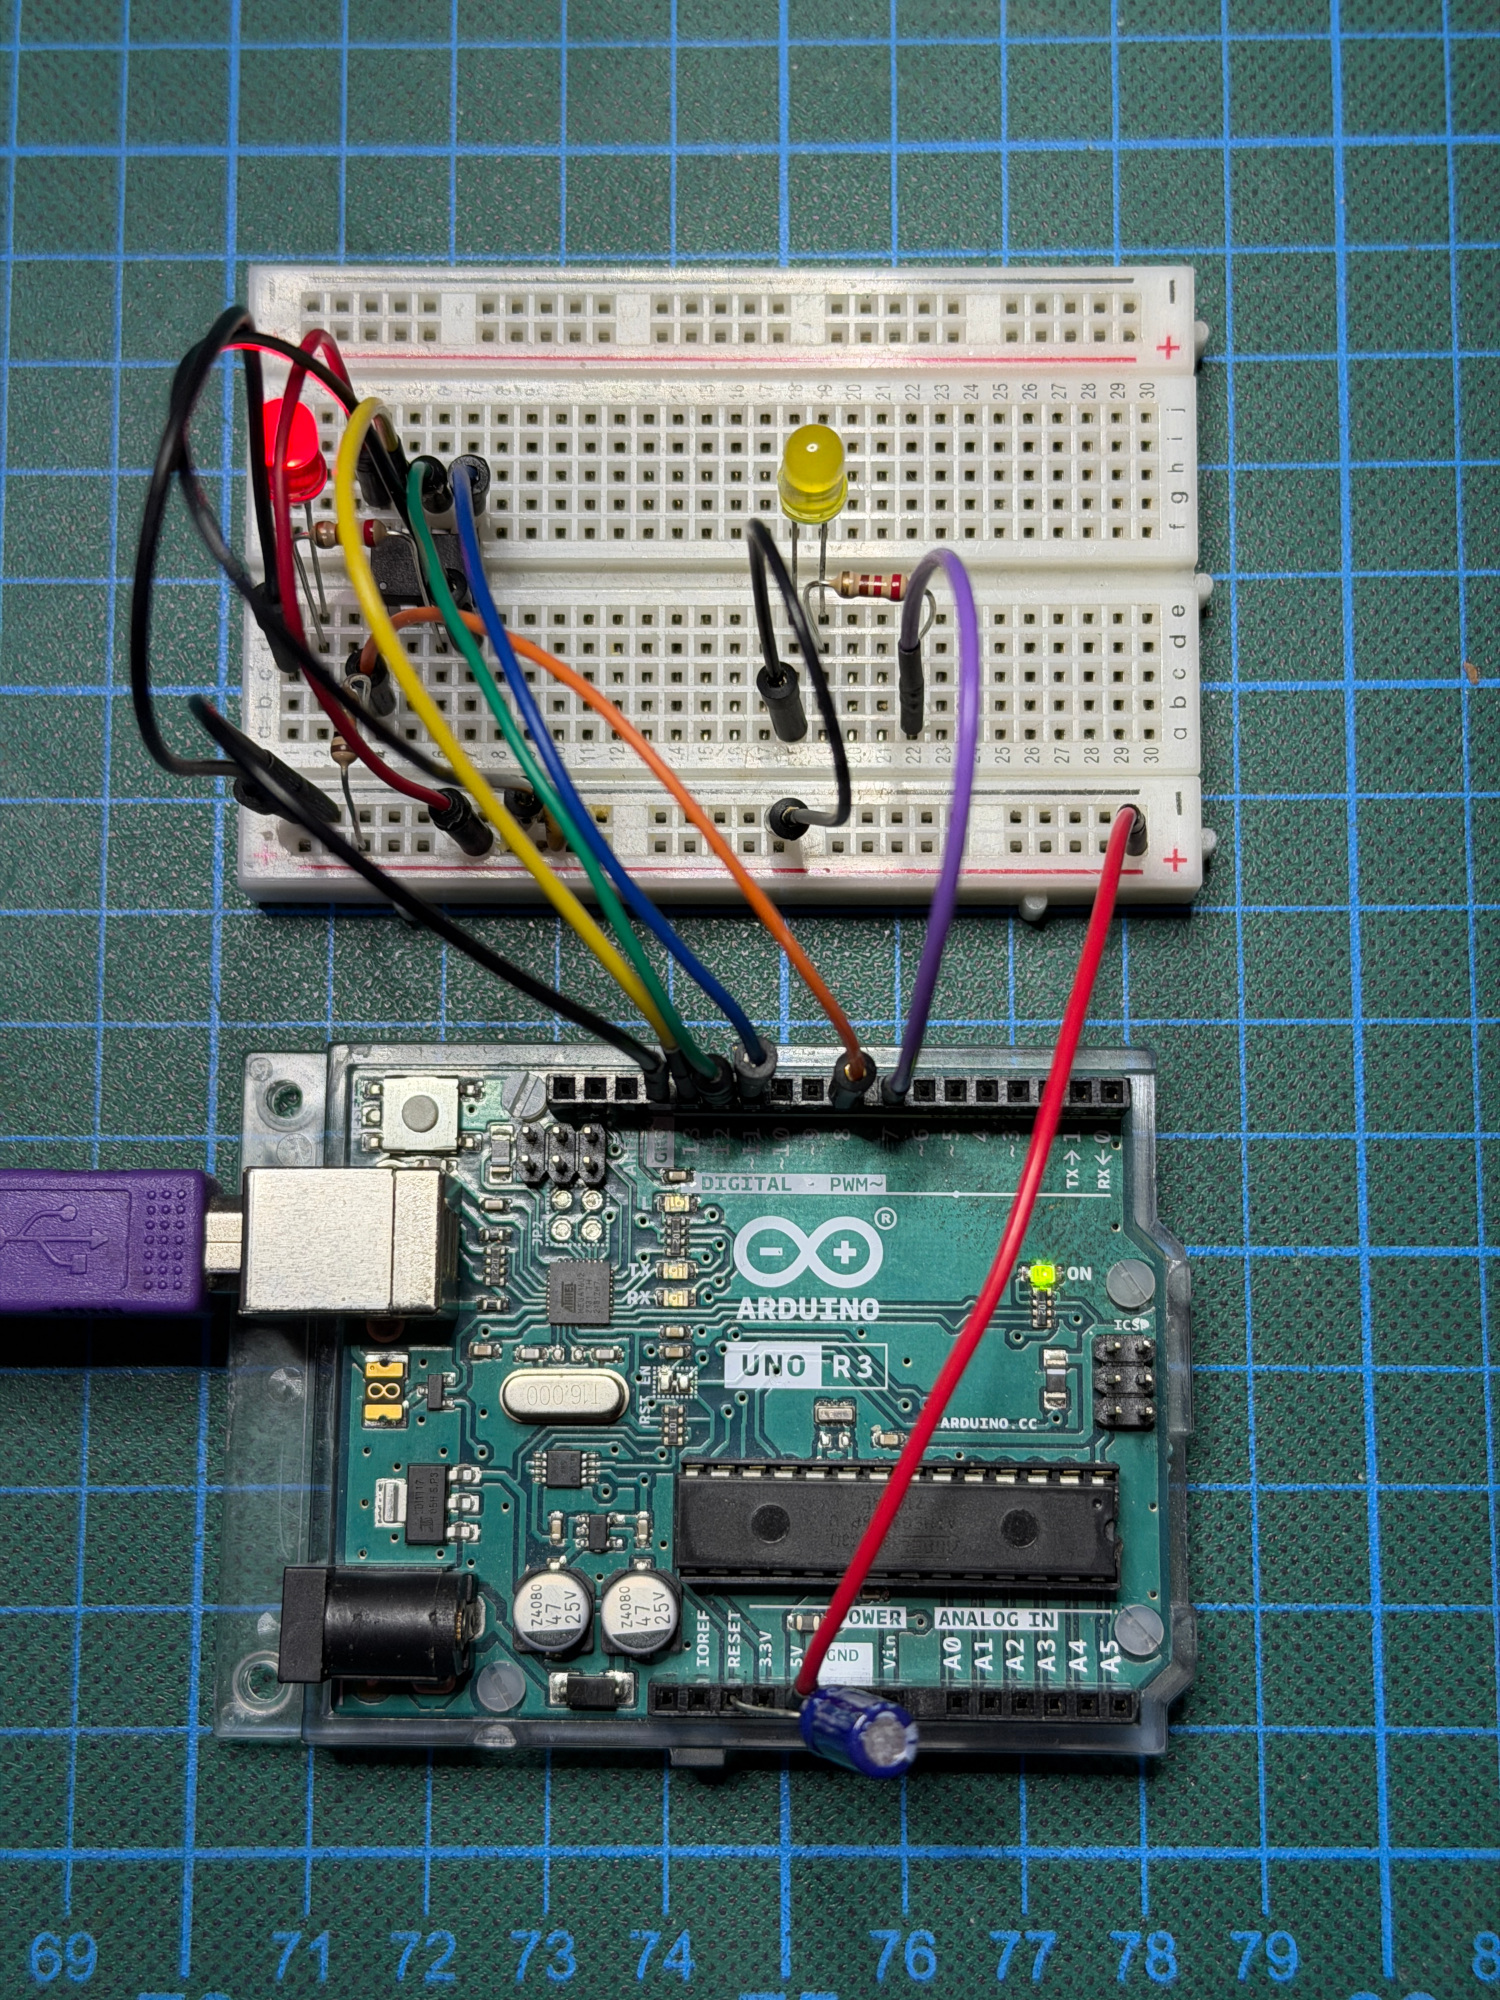
You need to set up the hardware on a breadboard and use six wires to connect the ATtiny to your Uno, turned into a hardware debugger. Note that the notch or dot on the ATtiny is oriented towards the left.
In reality, this could be like in the following photo.
Here is a table of all the connections so that you can check that you have made all the connections.
| ATtiny pin# | Arduino Uno pin | component |
|---|---|---|
| 1 (Reset) | D8 | 10k resistor to Vcc |
| 2 (D3) | ||
| 3 (D4) | 220 Ω resistor to target (red) LED (+) | |
| 4 (GND) | GND | red and yellow LED (-), decoupling cap 100 nF, RESET blocking cap of 10µF (-) |
| 5 (D0, MOSI) | D11 | |
| 6 (D1, MISO) | D12 | |
| 7 (D2, SCK) | D13 | |
| 8 (Vcc) | 5V | 10k resistor, decoupling cap 100 nF |
| RESET | RESET blocking cap of 10 µF (+) | |
| D7 | 220 Ω to system (yellow) LED (+) |
The yellow LED is the system LED, and the red one is the ATtiny-LED. The system LED gives you information about the internal state of the debugger:
- debugWIRE mode disabled (LED is off),
- waiting for power-cycling the target (LED flashes every second for 0.1 sec),3.
- debugWIRE mode enabled (LED is on),
- ISP programming (LED is blinking slowly),
- error state, i.e., not possible to connect to target or internal error (LED blinks furiously every 0.1 sec).
Step 4: Debug the program
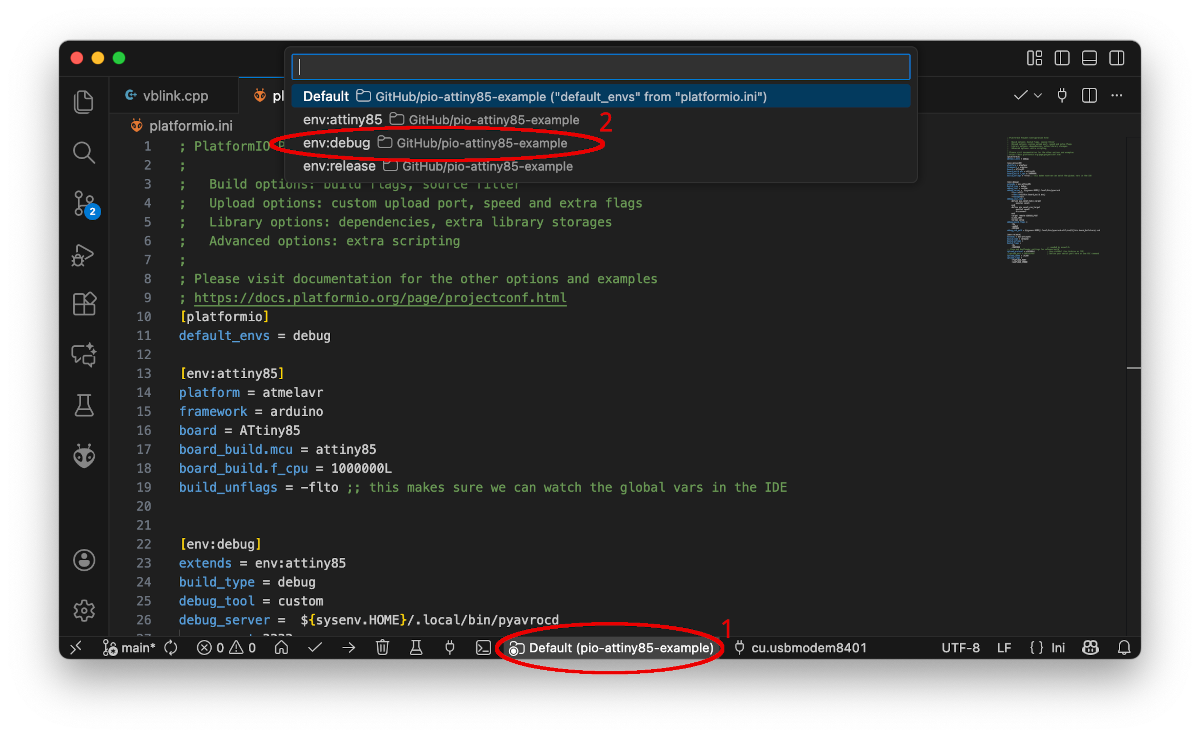
If you have not activated the debug environment, now is the time to do it. However, since the debug environment is the default one, it should already be active.
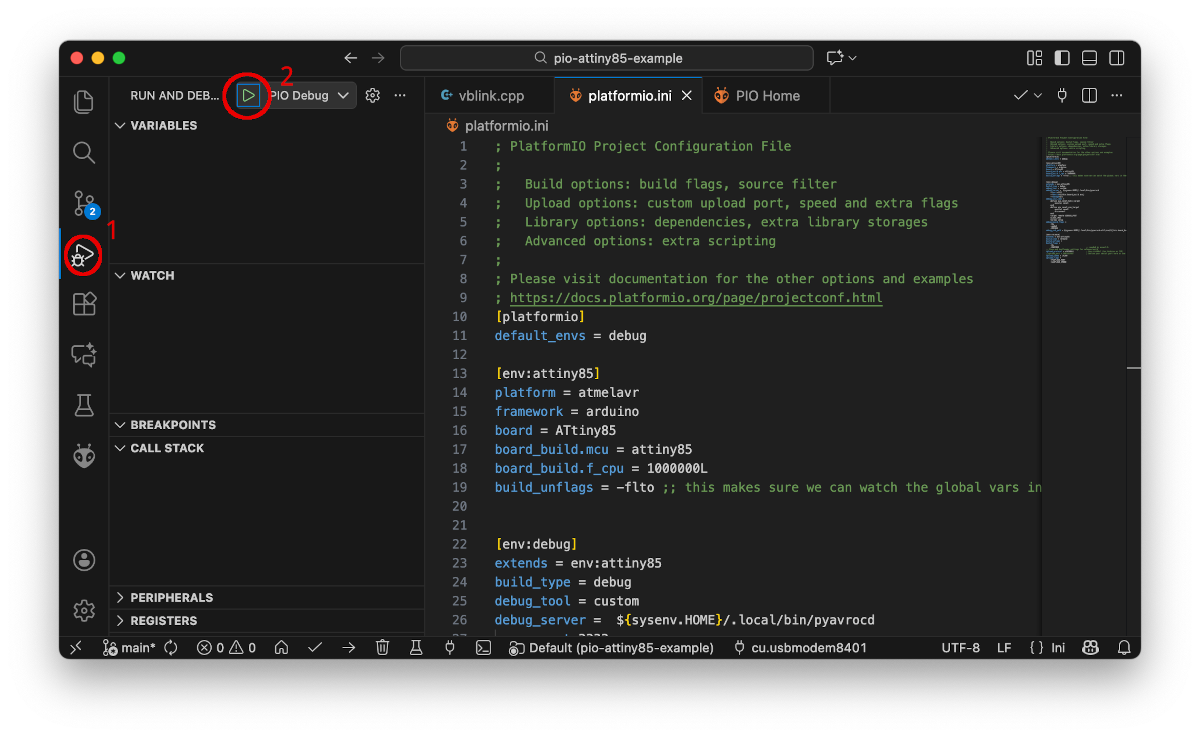
And then we are ready to go into business seriously. First, click the debug symbol (bug in front of the triangle) in the left side bar, which will bring up the debug panes on the left side. Then, click the green triangle at the top.
This will start the debugging process and open the TERMINAL window below the editor window. Click on the DEBUG CONSOLE label, so that this console will be opened. There, you will probably see that you should power cycle the target.
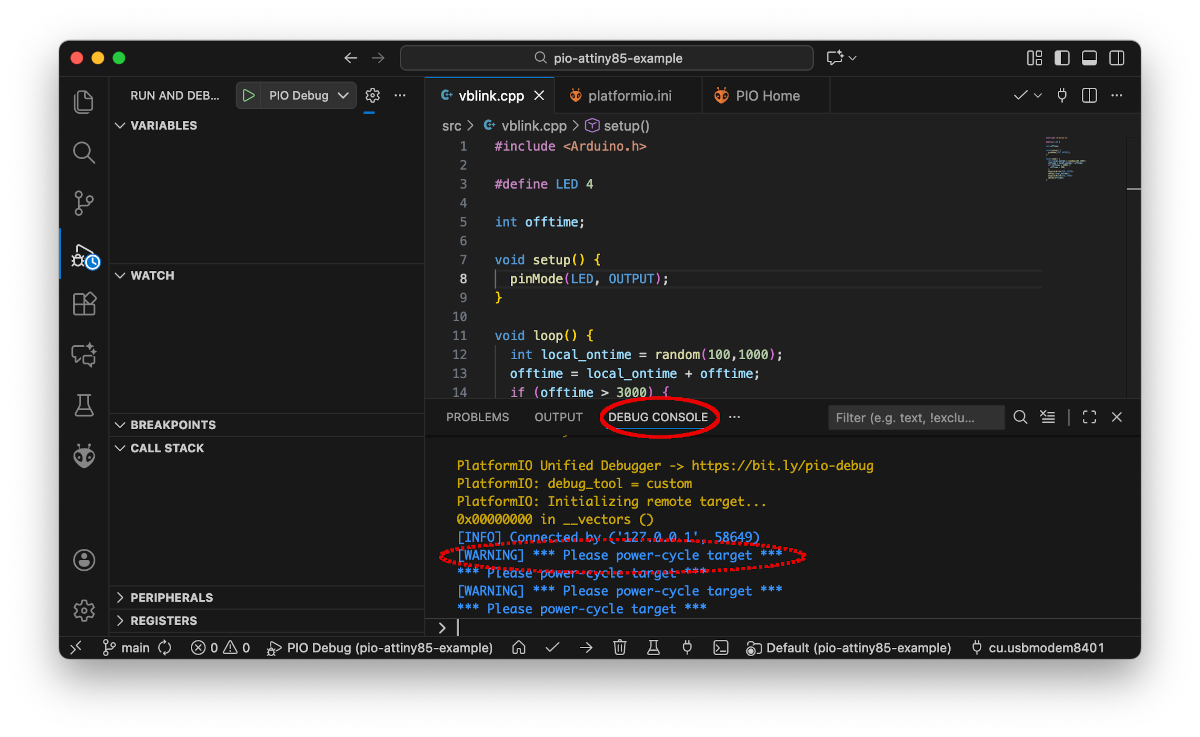
After having done that, the ATtiny is in debugWIRE mode, the executable will be loaded, and execution is started. The MCU will remain in debugWIRE mode even when debugging is stopped. You have to exit debugWIRE mode explicitly (see below).
After starting the debugger, program execution will stop in the first line of the internal main function, which is signified by the yellow triangle and the highlighted line. How you debug is sketched in the section on debugging.
Step 5: Start over or terminate the debugging session
If you have found the bug you were hunting, you can now leave the editor (red square), edit the program, and start again at step 6. Note that you always have to restart the debugger before any changes you made to the program are effective. In fact, changing the source text while you are debugging is not a good idea, because the correspondence between the compiled code and the source code will be lost.
Instead of starting a new edit/compile/debug cycle, you may want to call it a day and end debugging. In this case, you may wish to switch the MCU back into normal mode, in which ordinary SPI programming is possible. This can be accomplished by typing the command monitor debugwire disable into the input line of the DEBUG CONSOLE window (1) just before terminating the debugger (2).
Alternatively, you can also use the Disable debugWIRE project task under the Platform heading to disable debugWIRE mode.
Potential Problems
There is always the chance that something goes south, either debugging does not start at all, or something funny happens while debugging. If so, it is a good idea to have a look at the output in the DEBUG CONSOLE. Messages with the prefix [CRITICAL] often tell what went wrong. It may also be a good idea to consult the Troubleshooting and the Limitations sections.